U.S. Legal Services Industry

Legal Service Industry value added in chained dollars

The private sector, legal services industry in the United States has not recovered since the recession that began in late 2007 as many other professional service sector industries have. While annual industry revenue for the legal services sector is up, it is not keeping pace with inflation. In fact, the industry has been declining as a percent of the economy almost steadily since the turn of the century. The graph we present here shows the industry from 1987 through 2011 in terms of real value added, thus adjusted for inflation.

Industry value added is defined by the Bureau of Economic Analysis as “…the contribution of a private industry or government sector to overall GDP. The components of value added consist of compensation of employees, taxes on production and imports less subsidies, and gross operating surplus. Value added equals the difference between an industry’s gross output (consisting of sales or receipts and other operating income, commodity taxes, and inventory change) and the cost of its intermediate inputs (including energy, raw materials, semi-finished goods, and services that are purchased from all sources).”

Today’s market size is the estimated revenue collected by private sector legal services firms in the United States in 2012. This industry is identified within the North American Industrial Classification System with the code 541100.

Geographic reference: United States
Year: 2012
Market size: $270.567 billion
Source: Matt Leichter, “U.S. Legal Sector Contracting Even As Nation’s Economy Recovers,” The AM Law Daily, March 6, 2013, available online here and “Table 1 – Selected Services Estimated Quarterly Revenue for Employer Firms Fourth Quarter 2003 Through Fourth Quarter 2012,” part of the “Annual Benchmark Report for Services,” a U.S. Census Bureau series of reports available at the site here. The data presented in our chart come from the Bureau of Economic Analysis web site here.
Original source: U.S. Department of Commerce, Bureau of Economic Analysis and Census Bureau
Posted on March 18, 2013

Canada’s Legal Services

The legal services industry in Canada has grown annually since 2008 when it experienced a drop in revenues of 2.9% during the onset of the global financial crisis. Today’s market size is the value of total revenues earned by law firms—lawyers, barristers and solicitors primarily engaged in the practice of law— in Canada last year.

Geographic reference: Canada
Year: 2012
Market size: $26.7 billion.
Source: “Law Firms in Candad Industry Market Research Report Now Available from IBISWorld,” Digital Journal, March 6, 2013, available online here.
Original Source: IBISWorld
Posted on March 14, 2013

Indian Automobile Makers

Image of a street in India

Two- and three-wheel vehicles far out number four wheel vehicles in India. Nonetheless, the automobile manufacturing industry in that country is growing rapidly, it is expected that by 2015 the number of four-wheel vehicles produced in India will be twice the figure produced in 2012.

Today’s market size is the number of automobiles made in India in 2012 for the domestic market as well as the number of two- and three-wheel vehicles.

Geographic reference: India
Year: 2012
Market size: 3.1 million automobiles and 16.5 million two- and three- wheel vehicles.
Source: Jonny Williams, Digital Manufacturing, March 12, 2013, available online here. The photo above comes from the Enjoy India web site, here, with our thanks.
Posted on March 13, 2013

Instructional Technology

There is a lot of churn going on in the publishing world and the textbook segment of that industry is no different, in fact, it may be experiencing more upheaval and change than is the industry as a whole, though that would be very hard to quantify. Everyone in the publishing trade is adapting to the digital world in one way or another.

Today’s market size focuses on an industry in which eTextbooks are but a small part. The market size comes from a press release about a new market study. The elaborate title of that study is “Global Smart Education & Learning Market Advanced Technologies, Digital Models, Adoption Trends & Worldwide Market Forecast (2012—2017),” a title whose very complexity says a lot about the market being studied. That market, as defined by the study authors, includes far more than eTextbooks. It includes software applications, electronic libraries, curriculum systems, and much more. This market “caters to the needs of national governments and international standard bodies, educators from all streams and from different levels, stakeholders for training and workforce skills.”

Geographic reference: World
Year: 2011
Market size: $73.8 billion, of which, the North American market accounted for approximately 60% of this total revenue.
Source: “Global Smart Education And Learning Market Is Expected To REach A Value Of $220 Billion by 2017, New Report Says,” February 13, 2013, San Francisco Chronicle, available online here.
Original source: Research And Markets
Posted on March 7, 2013

Canned Fishery Products

Fishery products are canned for both human and animal consumption. In the United States, in 2010, 68.8% of all canned fishery products by weight were produced for human consumption and 31.3% for animal food and bait. In terms of value, the breakdown was 84.7% for human consumption and 15.3% for animal consummption.

Geographic reference: United States
Year: 2010
Market size: 954.14 million pounds valued at $1.411 billion
Source: “Fisheries of the United States–2010,” August 2011, page 46, available online from the National Marine Fisheries Service web site, here.
Original source: National Oceanic and Atmospheric Administration (NOAA), Office of Science and Technology, National Marine Fisheries ServiceUSDA
Posted on March 6, 2013

The Sleep Business

In 2012, approximately three fourths of internet users searched online for health information. Half of them searched specifically for sleep remedies. According to the National Sleep Foundation only 56% of Americans report getting a “good night’s sleep” on a typical night. Some sleep studies have found a link between insufficient sleep and hypertension, depression, diabetes, and other illnesses. Spending related to sleep has increased 8.8% yearly since 2008. Spending on over-the-counter sleep aids increased 31% from 2006 to 2011, with the biggest increase being spending on natural and homeopathic products.

Today’s market size is the estimated amount spent in the United States, in 2012, on things designed to aid sleep, from pills and medical devices to sleep consultants who work with hospitals and deluxe mattresses made with tension-relieving foams.

Wishing all our readers a sound night’s sleep!

Geographic reference: United States
Year: 2012
Market size: $32 billion
Source: Kit Yarrow, “The Sleep Industry: Why We’re Paying Big Bucks for Something That’s Free,” Time, January 28, 2013, available online here.
Posted on March 1, 2013

Gold Demand

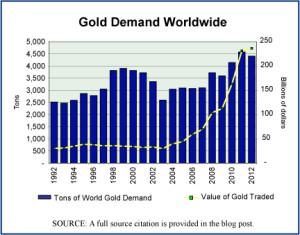
Gold demand trends worldwide, 1992-2012

The sharp rise in the price of gold since 2007 is a sign of how uncertain the financial world feels to many people since it went through a serious crisis in 2008. Although the United States abandoned the gold standard in 1933—thus severing the direct convertability of the U.S. dollar for a set weight and quality of gold—gold is still seen as one of the precious metals that will hold its value during deflationary times or times when other investments are risky. The trade in gold tends to rise during uncertain times as does the price of gold. The annual average price of gold rose during the first decade of the century by 340%, from $279.1 per troy ounce to $1,224.5.

Today’s market size is the volume and value of gold traded in 2000 and in 2012. The graph shows what the global demand for gold has done annually over the period 1992–2012. The increased demand in the last few years has been large but not nearly as large as the rise in the price of gold.

Geographic reference: World
Year: 2000 and 2012
Market size: 3,818 tons valued at $34.26 billion and 4,405 tons valued at $236.40 billion respectively
Source: “Gold Demand Trends, Full Year 2012,” February 2013, World Gold Council, available online here. The graph was produced with data from this same report, as well as the earlier editions of the same, from 1996 and 2005, both of which are available on the same WGC web site cited above.
Original source: LBMA, Thomson Reuters GFMS, and World Gold Council
Posted on February 28, 2013

Alternative Pet Care Services

With the slow economy, many Americans are cutting back on spending in many areas of their lives. Among pet owners, spending on pets does not seem to be one of these areas. In 2012, pet owners spent $53 billion on pet food, veterinary care and other pet-related services, up 5 percent from 2011. Included in this spending was alternative veterinary care services such as acupuncture.

Today’s market size shows the amount spent by pet owners in the United States on alternative veterinary care in 2012.

Geographic reference: United States
Year: 2012
Market size: $12.5 billion
Source: “Los Angeles: Americans Spent $53B on Pets in 2012,” Lansing State Journal, February 24, 2012, page 5A.
Original source: USA Today
Posted on February 26, 2013

Office Supply Stores

The news last week that OfficeDepot and OfficeMax, two of the big three office supply retailers, are planning to merge made us think that a look at retail sales in this sector might be interesting. Sales made through stores dedicated to office supplies and stationary—an industry identified by the U.S. Census Bureau with the industry code NAICS 45321—have not been keeping up with the growth in retail sales generally since 2000. The 1990s were a period of strong growth for these retailers. Big box stores were spreading and doing well. Growth began to slow in the early 2000s and has decline each year since 2007, with the onset of a recession in December of that year.

Between 2000 and 2012, total retail sales in the United States—less auto related sales—rose 58.6% while sales through office supply stores declined by 16.6%. Many factors are contributing to this decline. Primary among them are factors related to how we buy office supplies and not so much the volume of the supplies that we buy. The rising power of retailers with more general merchandise lines (Costco, Wal-Mart, etc.) is one significant factor as is the rie of online shopping.

Today’s market size is the value of sales at Office Supply and Stationary Stores in the United States in 1992, 2000, and 2012.

Geographic reference: United States
Year: 1992, 2000, 2012
Market size: $9.184, $22.75 and $19.11 billion respectively
Source: “Estimates of Monthly Retail and Food Services Sales by Kind of Business: 2012,” February 13, 2013, part of a series published by the U.S. Census Bureau monthly, and available here.
Original source: U.S. Department of Commerce, Bureau of the Census
Posted on February 25, 2013

Container Ships

The sharp rise in global trade over the last decades has been a boon to the shipping industry. The number of large container ships, which move so much of the increased quantity of partially and/or fully finished products being traded internationally, has grown and that growth is anticipated to continue through 2016 according to the World Shipping Council. The size of those ships is also on the rise.

The capacity of container ships—referred to in the trade as cellular vessels as they are designed to efficiently load and store freight containers one on top of the other with vertical braces at the four corners—is measured in terms of twenty-foot equivalent units (TEUs), or the number of twenty foot containers that the vessel can carry (these containers measure 20′ x 8′ x 8’6″). In the year 2000 the world fleet of container ships was made up of primarily ships with a capacity of 1,000 or fewer TEUs. Vessels this size made up approximately three quarters of the world fleet. In 2012, they represented less than 30% of the feet with much larger vessels dominating the trade. While the number of ships rose by only 2.8% between 2000 and 2012, the fleet’s carrying capacity almost tripled, rising 182%. So, the average per container ship capacity went from 1,200 TEUs in 2000 to 3,295 in 2012.

Today’s market size is the number and carrying capacity of cellular shipping vessels worldwide in 2000, in 2012, and a projection for where this fleet will stand in 2016.

Geographic reference: World
Year: 2000, 2012, 2016
Market size: Number of ships respectively: 4,828; 4,961 and 5,433
Market size: Carrying Capacity in million TEUs: 5.8; 16.34 and 19.83
Source: “Container Ship Types,” GlobalSecurity.org, July 7, 2011, available online here. “Cellular Fleet Forecast,” Alphaliner, February 2013, available online here.
Original source: Alphaliner
Posted on February 21, 2013