U.S. Electorate

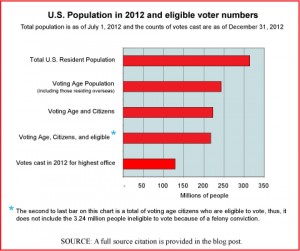
Chart

Today’s market size is the size of the voting population in the United States based on electoral results from the 2012 national election. We chose this topic for today by way of recognition of yesterday’s inaugural ceremonies. The chart provides an interesting view of how the electorate relates to the overall population. If you’re interested in a comparison of voter turnout rates by state, the source material for this post is a table that presents a great deal of detail at the state level. A link to that material is provided below. The state with the highest voter turnout in 2012—as it is most election years—was Minnesota.

Geographic reference: United States
Year: 2012
Market size: 130,234,600 votes counted (as of December 31, 2012)
Source: Dr. Michael McDonald, “2012 General Election Turnout Rates,” December 31, 2012, The United States Election Project, the Department of Public and International Affairs, George Mason University, available online here. The data used to produce the graphic are from this GMU source as well as the U.S. Census Bureau.
Posted on January 22, 2013
Fossil Fuel Subsidies

Since the turn of the century the price of crude oil has risen sharply, the result of increasing demand for a commodity whose supply can not increase quickly enough to meet demand. The dynamics of the petroleum market are becoming more clearly those of a market for something with a finite supply. This may seem obvious since petroleum in the form of crude oil is a finite product but for the 130 years before 2000, oil markets did not follow this pattern. The oil market was more elastic, reacting more quickly to rising and falling demand. This is because during that first 130 years of the oil age, the more easily and inexpensively accessible oil was being extracted, making the market function more like that of a commodity with nearly endless supply. As we have entered a period in which global oil production has plateaued, despite rising demand, prices have risen sharply and they are likely to continue to rise as growing demand outpaces supply.

Today’s market size looks at the amount spent globally on fossil fuel consumption subsidies. These are defined by the International Energy Agency (IEA) as “any government action directed primarily at the energy sector that lowers the price paid by energy consumers.” According to the IEA, changes in international fuel prices are chiefly responsible for differences in subsidy costs from year to year. The 30% year-over-year increase in the amount spent on fossil fuel consumption subsidies in 2011 closely tracked the sharp rise in international fuel prices.

Geographic reference: World
Year: 2011
Market size: $523 billion
Source: John Parnell, “IEA: Fossil Fuel Subsidies Increased 30% in 2011,” Responding to Climate Change, November 14, 2012, available online here.
Original source: International Energy Agency (IEA)
Posted on January 17, 2013

E-cigarettes

Electronic-cigarettes are devices designed to release nicotine vapor without actually burning tobacco, thus, without smoke. They are battery operated devices which look like cigarettes but use a battery to produce heat which then atomizes the nicotine in a specially made cartridge. While still a small fraction of the size of the cigarette market, the market for e-cigarettes is expected to grow rapidly.

Today’s market size is the estimated total value of e-cigarette sales in the United States in 2013.

Geographic reference: United States
Year: 2013
Market size: $1 billion
Source: Josh Sanburn,”A Quitter’s Market, Electronic-cigarette Sales Are Up, and Big Tobacco Wants In,” January 21, 2013, page 19, Time.
Original source: USB; Wells Fargo; Tobacco Vapor Electronic Cigarette Association
Posted on January 15, 2013

Cuban Imports

On the whole the United States has been a supporter and booster of free trade and globalization since the end of the second World War and with increased energy since the 1990s. Yet with one neighboring country, Cuba, trade relations have been unusual. The frictions in trade between the United States and Cuba date back to the 1950s and the Cuban Revolution, followed by a forty-year trade embargo imposed by the United States. In 2000, President Clinton signed the Trade Sanctions Reform and Export Enhancement Act which opened the door for some restrictive trade with Cuba, specifically, U.S. exports of farm and forestry products and some medicines. The act did not open the door for any imports from Cuba.

Today’s market size is the total value of products exported from the United States to Cuba in 2000, 2008, and 2011. The drop in exports from 2008 to 2011 is largely the result of the fact that under the restrictions imposed on this trade, Cuba is required to pay in advance for all U.S. imports in cash, something that became much harder as the financial crisis of 2008 took hold. By way of placing this level of international trade into perspective, according to CIA estimates, Cuba’s imports in 2011, from all over the world, totaled $14 billion.

Geographic reference: United States and Cuba
Year: 2000, 2008, 2011
Market size: $1.3, $711.5, and $363.3 million
Source: “2011 Exports of NAICS Total All Merchandise,” and interactive, online data resource published by the International Trade Administration and available online here. “The World Factbook,” entry on Cuba, published by the U.S. Central Intellegence Agency and make available online here.
Original source: ITA (U.S. Department of Commerce, Interantional Trade Administration) and the CIA
Posted on January 11, 2013

Office Coffee Service

The market for office coffee service—this service, often abbreviated OCS, provides companies with the hardware and consumables needed to supply their employees and guests with hot beverages, usually coffee—declined during the recession of 2007-2009 but began to grow again in 2011. This turn around occurred more quickly than did the rebound for the larger vending machine contractors industry generally. Credit is given by the industry to its ability to be flexible and to alter its offerings. In particular, the rising popularity of single-cup systems has helped the industry to weather economic cycles throughout the first decade of the 2000s.

Today’s market size is the value of the office coffee service market in 2011, a figure that was forecast to rise by 3.5% in both of the following two years.

Geographic reference: United States
Year: 2011
Market size: $4 billion
Source: “Report: Office Coffee Sales To Increase 3.5 Percent Annually in 2012 and 2013,” February 21, 2012, Vending Marketwatch, available online here.
Original source: Packaged Facts
Posted on January 10, 2013

U.S. Active Duty Military

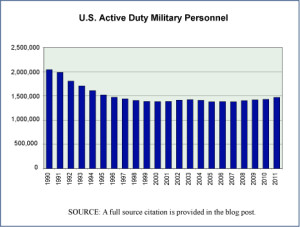
Active Duty Military, 1990-2011

Today’s market size is the size of the population of U.S. active duty military personnel. The chart to the right shows active duty military personnel figures from 1990 through August of 2011. The declining trend in this population, which appears clearly in the chart, is somewhat surprising given the United States’ involvement in “hostilities” in several parts of the world since 1990. One can see what appears at first blush to be a similarity with the economy at large in terms of reduced demand for labor and increased outsourcing. However, we only mention this seeming similarity here because such an assertion would require far more study and analysis to either present properly or disprove.

Geographic reference: United States
Year: 2010
Market size: 1.43 million
Source: “Table 510. Department of Defense Personnel: 1960 to 2010,” page 335, 2012 Statistical Abstract of the United States, available online through the Census Bureau’s web site, here.
Original source: U.S. Department of Commerce, Bureau of the Census and the U.S. Department of Defense.
Posted on January 7, 2013

Face-Lift Market

Some people choose to undergo cosmetic surgery because of perceived economic benefits to being more attractive. Some simply feel that they will be happier if they are more attractive according to society’s standards of beauty. Today’s market size shows the amount Americans spent on face-lifts in 2010.

Geographic reference: United States
Year: 2010
Market Size: $845 million
Source: Abigail Tucker, “How Much is Being Attractive Worth?” Smithsonian, November 2012, page 18, also available online Posted on January 4, 2013

Sales Taxes

With so much discussion of late about taxes, mostly income taxes, we thought we’d look at another tax. This one rests particularly heavily on those at the lowest end of the income scale. It is the sales tax.

Sales taxes vary greatly from state to state and within a state from area to area. An example of this is Warren County, New York, located at the southern end of the Adirondack Mountains and encompassing the beautiful resorts surrounding Lake George. As a region for which tourism is a major economic engine, it levies its own local sales tax. Total sales taxes of 7% are collected in Warren County, 4% is a state level tax which is passed on to the state and the remaining 3% is retained by the county. Please note that this local sales tax may not be included when the U.S. Census Bureau does studies of national sales tax collections for a particular year by looking at the totals collected by each state. It depends on whether or not the state in question includes that local sales tax revenue in its summary of tax collections reported to the Census Bureau.

Today’s market size is the total collected for sales taxes in the United States by states in 2011. These sales taxes accounted in 2011 for 48.4% of the total of all taxes collected by state governments.

Geographic reference: United States
Year: 2011 (fiscal year)
Market size: $366.54 billion
Source: “State Government Tax Collections Summary Report: 2011,” April 12, 2012, a report from the Census Bureau available online here.
Original source: U.S. Department of Commerce, Bureau of the Census
Posted on January 3, 2013 (still seems odd, 2013!)

Champagne

By definition, champagne is a product of France. In order to be called champagne, a sparkling wine must be made with grapes from the Champagne region of France and must meet an additional set of requirements imposed by the Comité Interprofessionel du Vin de Champagne (CIVIC). The United Kingdom is the largest importer of champagne, followed by the United States and then Germany. U.S. imports of champagne started off the first decade of the new century averaging 18 million bottles annually, it peaked at 23.2 million bottles in 2006 and fell thereafter for three consecutive years. In 2010, champagne imports to the United States saw a small increase from prior year imports.

Today’s market size is the estimated total number of bottles of champagne exported by France in 2011.

Geographic reference: Worldwide
Year: 2011
Market size: 335 million bottles
Source: Tiffany Hsu, “Champagne Sales Surged in 2011, Booze Headed for 2012 Boost,” January 1, 2012, Los Angeles Times, available online here.
Original source: Comité Interprofessionel du Vin de Champagne and the Champagne Bureau
Posted on December 27, 2012

Christmas Decorations

Our last post looked at Christmas trees and it got us to thinking about all the decorations that go on those trees as well as on buildings, in building, and all over the place. Thus, today’s market size post, an estimate of the total spent on Christmas decorations in the United States last year. As the source explains, the 2011 figure was 8% above that spent the prior year.

Geographic reference: United States
Year: 2011
Market size: $6 billion
Source: Joe Mont, “$6 Billion for Christmas Lights?” MSN Money, December 12, 2011, available online here.
Original source: National Retail Federation and BIG Research.
Posted on December 19, 2012