Christmas Tree Farming

The sale of natural trees for use as Christmas trees has been on the decline in the United States for some time. Most likely, the decline in numbers of trees sold annually has more to do with the rise in the use of artificial trees than to an overall decline in households and establishments decorating trees for the season. In 2009, Christmas tree production in the United States was down 60% from its pace just seven years earlier, in 2002 (a U.S. Economic Census year) when 20.8 million trees were grown for sale.

Today’s market size is the number of Christmas trees grown for sale in the United States in 2009 and their approximate value that year.

Geographic reference: United States
Year: 2009
Market size: 12.9 million trees valued at $248.9 million.
Source: Dan Burden and J.S. Isaacs, “Christmas Tree Profile,” March 2012, AgMRC, available online here.
Original source: Agricultural Marekting Resource Center, Census of Horticultural Specialties, USDA and the National Christmas Tree Association.
Posted on December 17, 2012

World Cement Market

Cement production in the world is dominated by China, whose production in 2011 accounted for 53.7% all cement made globally. The third largest cement company in the world is China National Building Materials Company Limited often seen abbreviated as CNBM. Chinese companies also account for 7 additional companies on the 2011 list of the top 20 cement companies globally. The top two companies on that list are Lafarge (from France) and Holcim (from Switzerland).

Today’s market size is the total number of metric tons of cement produced worldwide in 2011, a number which represents a 9% increase on the 2010 figure.

Geographic reference: Worldwide
Year: 2011
Market size: 3.6 billion metric tons
Source: “Top 20 Global Cement Companies,” December 2012, Global Cement Magazine, page 14.
Original source: European Cement Association
Posted on December 13, 2012

Tablets versus e-Readers

Two relatively new devices in the world of mobile, electronic devices are often compared. They do similar things and yet, they are not the same. These are Tablets and e-Readers. Because tablets tend to offer more functionality than do e-readers, one of those functions being to serve as an e-Reader, the sales for these devices are often compared. And, in recent years, tablets have been steadily outselling e-readers.

Today’s market size post is the number of tablets and e-readers sold around the world in 2010 and a projection of that market for next year, 2013.

Geographic reference: World
Year: 2010 and 2013 projection
Market size: Tablets: 19 million units and 172 million
Market size: e-Readers: 13 million units and 18 million respectively
Source: Felix Richter, “Are Tablets Killing E-Readers?,” Statista.com, July 12, 2012, available online with an interesting chart here.
Original source: IDC, MIC
Posted on December 11, 2012

Bubble Gum

Today we look at the market for bubble gum and in particular the estimated value of sales of bubble gum in the U.S. domestic market this year.

Geographic reference: United States
Year: 2012 estimate
Market size: $206.9 million
Source: Andrew Adam Newman, “Change Comes to Playgroud Funny Papers,” New York Times, page B3, November 30, 2012. Cows and Production by State and Region,” September 20, 2012, part of a series of reports produced by various agencies within the USDA’s Economic Research Service and available online here.
Original source: Euromonitor International
Posted on December 7, 2012

Formal Wear & Costume Rental Services

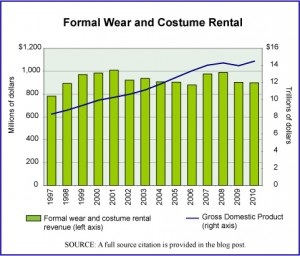
Formal Wear Rentals and GDP

The service sector of the U.S. economy is divided into many subsectors, one of which is the Rental and Leasing Services sector, designated in the North American Classification System with the number 532. This subsector covers activities as diverse as car rental firms, the leasing of office equipment, and the rental of formal wear and costumes. Today’s market size post looks at the last of these items, the business of renting formal wear and costumes which has held its own over time but has not kept up with the growth of the economy generally.

The graph shows revenue for businesses engaged in renting fomral wear and costumes from 1997 through 2010 and by way of comparison, the gross domestic product is presented on the graph as a line.

Geographic reference: United States
Year: 2010
Market size: $899 million
Source: “Table 5.1. Real Estate and Rental Leasing Services (NAICS 53)—Estimated Revenue for Employer Firms: 2002 Through 2010,” February 2, 2012, one of the tables in the 2012 Service Annual Survey, available from the Census Bureau web site here. Data used in the graph come from earlier editions (2003) of the Service Annual Survey, available from the Census web site here.
Original source: U.S. Department of Commerce, Bureau of the Census
Posted on December 5, 2012

Fish Oil

Fish oil is a commodity derived from the tissues of oily fish. This oil contains high levels of the Omega-3 fatty acids eicosapentaenoic acid (EPA) and docosahexaenoic acid (DHA) which is part of the reason that offerings of fish oil as a dietary suppliment have seen growing popularity. Today’s market size is the volume and value, at a wholesale level, of fish oil production in the United States in 2010.

Geographic reference: United States
Year: 2010
Market size: 136.4 million pounds or 17.6 million gallons valued at $30.1 million
Source: “Fisheries of the United States–2010,” August 2011, page 42, available online from the National Marine Fisheries Service web site, here.
Original source: National Oceanic and Atmospheric Administration (NOAA), Office of Science and Technology, National Marine Fisheries Service USDA
Posted on December 3, 2012

College Enrollment

While we at ECDI don’t really see education as a market driven endevour, there is no question that educational services are an important part of the U.S. economy. Public expenditures on education account for between 5% and 6% of Gross Domestic Product (GDP) annually, as measured in value added. Educational services in the private sector account for another 1% to 1.5% of GDP. Today we look at enrollment in post secondary educational institutions of all sorts in the United States as our market.

Several interesting details about 2011 college enrollment in the United States are these: of the total enrolled, more than half were females (55.2% versus 44.8%); most were full time (73%); most were enrolled in public institutions (79%), and slightly more than half of the students were employed, either part time (27.5%) or full time (25.7%). For anyone interested in more details about this “market,” the source from which we obtained today’s market size—link provided below—offers a very detailed breakdown of college enrollment in the United States, by demographic characteristics as well as by type of institution and by years in school.

Geographic reference: United States
Year: 2011
Market size: 20.4 million
Source: “Table 5. Type of College and Year Enrolled for College Students 15 Years Old and Over, by Age, Sex, Race, Attendance Status, Control of School, Disability Status, and Enrollment Status: October 2011,” part of the Current Population Survey series produced and made available to us all by the U.S. Census Bureau on their web site here.
Original source: U.S. Department of Commerce, Census Bureau.
Posted on November 30, 2012

Bioinformatics

Over the last decade bioinformatics has been characterized by the mapping of many genomes. This has fueled explosive growth in the field generally, growth which is anticipated to continue into the future.

Bioinformatics, in the most basic sense, is the application of information technology to the life sciences to increase the understanding of biological and chemical processes. It is the study of the methods for storing, retrieving and analyzing biological data, a wealth of which is growing rapidly and thus feeding demand for more bioinformatics. Fields that benefit from the output of bioinformatics are many, including especially agricultural biotechnology, pharmaceutical research and development, and medical and clinical diagnostics.

Today’s market size is the estimated value of this hybrid industry in 2012 and a projected value for 2018.

Geographic reference: World
Year: 2012 and 2018
Market size: $2.3 billion and $9.1 billion respectively
Source: “Global Bioinformatics Market is Expected to Reach USD 9.1 Billion in 2018: Transparency Market Research,” November 28, 2012, Haroldonline.com, a link to which is here.
Original source: Transparency Market Research, whose study on this industry may be purchased on their web site here.
Posted on November 28, 2012

Cranberries

Today we look at cranberries, one of the ingredients of a traditional Thanksgiving Day meal in the United States. The market we present here is the size, measured in barrels, of U.S. cranberry production annually over four decades.

We hope that as the Thanksgiving Holiday weekend proceeds in the United States, that all of our visitors have many reasons to give thanks this year.

Geographic reference: United States
Year: 1980, 1990, 2000, 2010
Market size: 2.70, 3.44, 5.84, and 6.81 million barrels respectively
Source: “Cranberries—2012 Cranberry Production Down Slightly,” August 14, 2012, and earlier reports on Cranberry production, all produced and made available by the U.S. Department of Agriculture’s National Agricultural Statistics Services. The Annual reports on Cranberry production are listed on the USDA’s web site here.
Original source: U.S. Department of Agriculture
Posted on November 21, 2012

Used Car Dealers

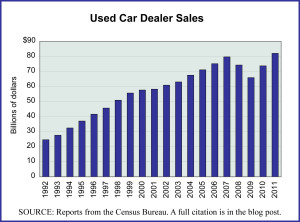
U.S. Used Car Dealer Sales, 1992-2011

The U.S. auto industry was hit particularly hard by the last recession and financial crisis. For those selling used cars, the recession was less sever than for car manufacturers and new car dealers. As an industry, used car dealers saw a downturn in sales for two years (2008 and 2009) but by 2011 had completely recovered and exceeded their pre-recession sales while new car dealers were still 10% off of their 2007 peak sales.

The graph shows annual sales for U.S. used car dealers from 1992 through 2011. As can be seen in the graph, while the used car industry can usually weather a recession well, as demand for used cars is less impacted by and overall downturn than are sales of new cars, the recession from late 2007 through 2009 was not a “normal” recession. Financial system crises, as the one that started in 2008, lead to more sever and long term troubles for the economy and they even impact industries that are immune to cyclical recessions.

Geographic reference: United States
Year: 2011
Market size: $82.07 billion
Source: “Estimates of Monthly Retail and Food Services Sales by Kind of Business: 2011,” Monthly Retail Trade Report, November 14, 2012, data for the NAICS industry 44112. The graph was sourced from the same report as well as the Annual Retail Trade Survey 2010, March 30, 2012. Both reports are available online at the Census Bureau web site.
Original source: U.S. Department of Commerce, Bureau of the Census
Posted on November 19, 2012