Breaded Shrimp

Today’s market size is the weight and value of breaded shrimp produced in the United States in 2010.

Geographic reference: United States
Year: 2010
Market size: 123.6 million pounds at an estimated wholesale value of $583.7 million dollars
Source: “Fisheries of the United States–2010,” August 2011, page 42, available online from the National Marine Fisheries Service web site, here.
Original source: National Oceanic and Atmospheric Administration (NOAA), Office of Science and Technology, National Marine Fisheries Service, USDA
Posted on November 16, 2012

Floor Covering Store Sales

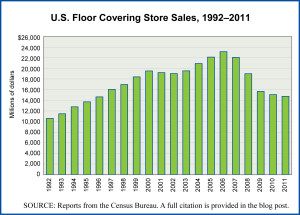
Floor Covering Stores Sales, 1992--2011

Today’s market size is the volume of sales made through U.S. stores whose primary line is floor coverings. Sales peaked in 2006 at $23.15 billion before falling sharply as the housing bubble burst and the financial crisis took a tole on all retailers. The sales shown here do not include the sale of floor coverings made through general merchandising stores. The impact over the last decades of the growth in sales of floor coverings through such outlets is part of what is seen in the trajectory of sales shown in the graph.

The graph shows annual sales through Floor Covering Stores in the United States from 1992 through 2001. The data for 2011 are preliminary and come from a separate Census Bureau report than the data for the rest of the years shown.

Geographic reference: United States
Year: 1992, 2006 and 2011
Market size: $10.50, $23.15 and $14.74 billion respectively
Source: “Estimated Annual Sales of U.S. Retail and Food Services Firms by Kind of Business: 1992 Through 2010,” Annual Retail Trade Survey 2010, March 30, 2012, and “Monthly Retail Trade and Food Services,” October 15, 2012, both reports are from the U.S. Census Bureau and available at the agency’s web site here..
Original source: U.S. Department of Commerce, Bureau of the Census
Posted on November 14, 2012

Portable Generators

The recent hurricane that did so much damage along the north eastern coast of the United States has caused a spike in the sale of portable generators that convert fuel—gasline, deisel, natural gas, propane, etc.—into electric power. These systems are often referred to as Gensets and two of the leading manufacturers of such systems are Cummins and Caterpiler. Today’s market size is the value of the portable generator market worldwide in 2011 and the forecasted value by 2020.

Geographic reference: World
Year: 2011 and 2020
Market size: $12 billion and $22.3 billion respectively
Source: “Research and Markets: Diesel and Gas Generator, 2012 – Global Market Size, Segmentation and Equipment Market Share to 2020,” August 30, 2012, BusinessWire, available online here.
Original source: GlobalData
Posted on November 12, 2012

Polling Services

The long political campaign season is finally over in the United States. One of the striking aspects of this year’s campaign cycle was the seemingly endless supply of new polling data, from multiple sources on a daily basis.

Today’s market size is the size of the revenues for the polling services industry in the United States, in 2002 and 2010. The industry is defined, within the North American Industrial Classification System, as follows: “This industry comprises establishments primarily engaged in systematically gathering, recording, tabulating, and presenting marketing and public opinion data.” It’s industry code is 541910. The sorts of services provided by this industry include:

Broadcast media rating services
Marketing analysis services
Marketing research services
Opinion research services
Political opinion polling services
Public opinion polling services
Public opinion research services
Statistical sampling services

Geographic reference: United States
Year: 2002 and 2010
Market size: $10.89 billion and $16.74 billion respectively
Source: “Table 6.1. Professional, Scientific, and Technical Services (NAICS 54) – Estimated Revenue for Employer Firms: 2002 Through 2010,” 2010 Service Annual Survey, February 2, 2012, available online from the Census Bureau’s web site.
Original source: U.S. Department of Commerce, Bureau of the Census
Posted on November 9, 2012

Tuna

Tuna fish, in the form of canned tuna is a staple of the U.S. diet and is the largest of the canned fish markets by both weight and value. Today’s market size is the production in 2010 of canned tuna in the United States.

Geographic reference: United States
Year: 2010
Market size: 395.4 million pounds at an estimated wholesale value of $723.8 million dollars
Source: “Fisheries of the United States–2010,” August 2011, page 42, available online from the National Marine Fisheries Service web site, here.
Original source: National Oceanic and Atmospheric Administration (NOAA), Office of Science and Technology, National Marine Fisheries Service USDA
Posted on November 6, 2012

Commodity Contract Dealers

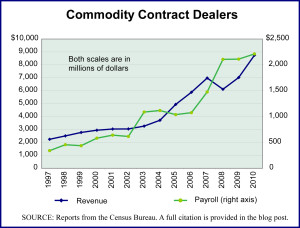
Commodity Contract Dealers Industry 1997-2010

With the growth of globalization and the rise in consumption levels in many parts of the world, the cost of basic commodities has been on an strongly upward trajectory but one with with great fluctuations. Such fluctuations in commodity prices tend to favor attempts to trade in futures by way of limiting the uncertainty of volatile prices. The services of commodity contract dealers have been in high demand and they have done quite well. The growth in both revenue and employment in the commodity contracts business shows how it has survived the recession and financial crisis of 2007–2009 far better than most industries.

The graphic presents annual revenue and payroll for Commodity Contract Dealers [NAICS 523130] in the United States from 1997 through 2010. Over this period, industry revenues grew by a very healthy 290% and payroll grew by an even more impressive 549%. In 1997, payroll accounted for 15% of revenue for this industry. In 2010 payroll accounted for 25% of revenue, off from a high of 34.5% of revenue reached in 2008. Total number employed by this industry also grew over the period 1997–2010, by 152%, from 4,519 to 11,400.

Today’s market size is the total industry revenue generated by commodity contract dealers in the United States in 2010.

Geographic reference: United States
Year: 2010
Market size: $8.75 billion
Source: Economic Census reports on the NAICS industry 523130 from the 1997, 2002, and 2007 Economic Censuses. The 2003 and 2010 editions of the Service Annual Survey, “Table 4.1. Finance and Insurance (NAICS 52) — Estimated Revenue fro Employer Firms.” All of these reports are available online from the Census Bureau’s web site here.
Original source: U.S. Department of Commerce, Bureau of the Census
Posted on November 1, 2012

Canned Clams

U.S. canned clam production in 2010 is the market size today. The value per pound for canned clams in 2010 was just shy of one dolar ($0.89). As compared with the highest volumn canned fish product, namely tune, canned clams were 27.7% of tuna by weight and 13.5% by value.

Geographic reference: United States
Year: 2010
Market size: 109.3 million pounds at a value of $97.2 million dollars
Source: “Fisheries of the United States–2010,” August 2011, page 42, available online from the National Marine Fisheries Service web site, here.
Original source: National Oceanic and Atmospheric Administration (NOAA), Office of Science and Technology, National Marine Fisheries ServiceUSDA
Posted on October 25, 2012

Baseball Equipment

Go Tigers!

Today we look at the market for baseball equipment: bats, shoes, gloves and balls. The market size presented below is for baseball equipment used by all those playing the game, from little league teams to those playing for Major League Baseball.

Our selection of topic today is not without an alterior motive, namely to cheer on our local team as it prepares to play game one of the 2012 World Series of Baseball.
Go Tigers!

Geographic reference: United States
Year: 2005
Market size: $615 million
Source: “The Baseball Market,” 2006, The Active Network Inc., available online here.
Posted on October 24, 2012

Classic Cars

Concours d'Elegance, summer 2011, Michigan

The market for classic cars has been very strong over the last two decades in the United States. It is one of the niche markets used by the well healed as both an investment vehicle and a hobby. Today’s market size is the approximate value of classic car auction sale totals in 1995 and 2011.

Geographic reference: United States
Year: 1995 and 2011
Market size: $45 million and $500 million respectively
Source: Scott Rosenblatt, ” Total Auction Sales,” page 21, Classic Cars: Your Portfolio’s Midlife Crisis, 2012, Credit Suisse, available online here.
Original source: Classic Car Auction Yearbook (data Historica Selecta)
Posted on October 23, 2012

Waste Collection Services

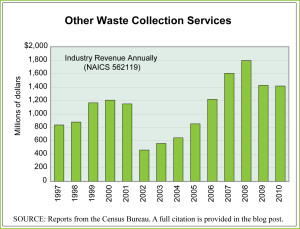
Revenue annually

Dealing with waste is big business and one likely to continue to thrive as basic commodity prices rise, making the segregation of reusable matierals from our overall waste flow more economical. Today we look at one of the industries in the larger Waste Management sector.

This industry is defined by the U.S. Census Bureau as comprising “establishments primarily engaged in collecting and/or hauling waste (except nonhazardous solid waste and hazardous waste) within a local area.” This includes all firms involved in the collection of nonhazardous waste and recyclable materials from homes, businesses, construction sites, government facilities, commercial centers and the like. This industry does not include standard garbage collection firms that collect solid waste on a regular schedule nor firms that handle hazardous waste. Worth noting is the fact that in 2010 the U.S. industry being highlighted here had revenues equal to 3.7% of those reported by the larger, solid waste collection firms that run regular routes and collect the vast majority of our solid waste.

The graph shows U.S. industry revenues annually over the period 1997 to 2010. The industry grew by 69% over this peirod but as the pattern on the graph shows, it is not immune to economic cycles. For anyone interested in knowing more about the trends in the United States regarding how much we throw away and how much we recycle, here is an interesting blog post showing several decades worth of such trends graphically.

Geographic reference: United States
Year: 1997 and 2010
Market size: $838 million and $1.4 billion respectively
Source: “Table 7.1. Administrative and Support and Waste Management and Remediation Services (NAICS 56) – Estimated Revenue for Employer Firms: 2002 Through 2010,” 2010 Service Annual Survey, produced in all non economic census years and available online here. The graphic supplements the 2010 Service Annual Survey data with data from prior editions of the same report, also available online, at the Census Bureau’s web site, here.
Original source: U.S. Department of Commerce, Bureau of the Census
Posted on October 18, 2012