Veterinary Services

According to the American Pet Products Association, 62% of households in the United States (72.9 million) owned at least one pet in 2011. From 2006 to 2011, the price of veterinary care increased 46%. Data show the amount pet owners spent on veterinary services in 2011. This was slightly more than 25% of all pet-related spending by pet owners. In 2012, spending on veterinary care is expected to rise to $13.6 billion.

Geographic reference: United States
Year: 2011
Market Size: $13.4 billion
Source: “Industry Statistics & Trends,” American Pet Products Association, available online here and ASPCA Pet Health Insurance: New Member’s Guide to Coverage, 2012.
Posted on September 18, 2012

Charitable Giving

Today’s market size post provides a measure of charitable giving in the United States last year. Charitable giving was greatly impacted by the recession and finacial system melt-down of 2007–2009 but contributions have been rising as the economy recovers, slowly. In 2011, charitable giving totals were up 4% over giving in the prior year but were still 11% lower than the total giving in 2007. Of interest is the fact that contributions made by individuals accounted, in 2011, for 73% of all chartiable giving in the United States.

Geographic reference: United States
Year: 2011
Market size: $298 billion
Source: “Giving Statistics,” National Park Service web site posting with a great deal of information reproduced from the report listed below as the Original Source. Here is a link to the National Park Service web site.
Original source: Giving USA 2012, American Association of Fundraising Councel.
Posted on September 14, 2012

Food and Beverage Store Sales

Food & Beverage Store Sales

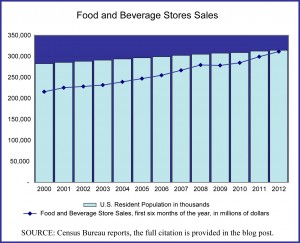
In the United States, people pay less than anywhere else in the world for food, as a percentage of their total expenditures. Here is a link to a site with a very interesting world map showing U.S. Department of Agriculture and Euromonitor data on how much of our total expenditures we spend on food worldwide, nation by nation. As many people worry about the cost of food rising it is worth noting, at the most basic level, just how inexpensively we’re able to feed oursleves in the United States.

Today’s market size is the value of food and beverage stores in the United States for the first six months of 2000 and 2012. The graph shows the first six months of each year’s food and beverage store sales for the entire period.

Geographic reference: United States
Year: 2000 and 2012 (January – June)
Market size: $215.6 and $311.2 billion respectively
Source: Monthly Retail Trade Report, August 14, 2012, part of a series of reports by the U.S. Census Bureau, available online here.
Original source: U.S. Department of Commerce
Posted on September 13, 2012

Growing Market for Epinephrine

Anyone with a child in school these days is likely to be very aware of the growing concerns ralated to food allergies. In many elementary schools in the United States, special tables in the lunch room are set aside for children whose lunches contain any nuts, like the traditional peanut butter and jelly sandwich. In some schools, foods containing nuts of any kind are banned entirely. This is because of a rising number of children who suffer from food allergies, particularly nut allergies, and the rising severity of their allergic reations.

Nut allergies have been the fastest growing food allergies in recent years. In 1997, approximately 278,000 children under the age of 18 in the United States (0.04% of the age group) suffered from an allergy to peanuts. In 2008, that number had risen to over a million (1.5% of children in the age group).

Today’s market size is an estimated number of children (under the age of 18 years) in the United States who suffer sever food allergies. It is a calculation based on a study that showed that one in thirteen children suffer food allergies and that nearly 40 percent of those children suffer sever allergic reactions, sever enough to require the use of a drug like epinephrine to combat the reaction and save their lives.

Geographic reference: United States
Year: 2010
Market size: 2.28 million
Source: Katie Thomas, “Tiny Lifesavers for a Growing Worry,” The New York Times, page B1, September 8, 2012. Population data used to calculate todays market size are from “Table 1. Population by Sex and Selected Age Groups: 2000 and 2010,” Age and Sex Composition: 2010, May 2011, one of the Census Bureau’s reports on the 2010 Census of the United States, available here.
Original source: A study published in the journal Pediatrics and referenced in the source article listed above.
Posted on September 12, 2012

Military Expenditures Worldwide

On the 11th anniversary of terrorist attacks on the United States, we look at military spending for today’s market size post. According to a recent report by the Stockholm International Peace Research Institute which tracks military spending worldwide, the response to the September 11 attacks was “one of the dominating factors of the global security environment over the past 10 years, and a key factor influencing military spending in many countries.

Today’s market size is the measure of all military expenditures by countries around the world in 2011, of which the top three by overall spending were the United States with 41% of the total expenditure, China with 8%, and Russia with 4%.

Geographic reference: World
Year: 2011
Market size: $1.738 trillion
Source: SIPRI Yearbook 2012, Armaments, Disarmament, and International Security, Summary, pg. 8-9, published in 2012 by the Stockholm International Peace Research Institute. The summary report is availalble online here.
Original source: SIPRI
Posted on September 11, 2012

Public School Students

School bus arrives on day 1

As the summer comes to a close and school aged children head back to school we present the estimated number of children in the United States attending public elementary or secondary schools during the 2011/2012 academic year. Worth noting is the fact that, based on 2010 U.S. Census data, there were 53,980,105 people in the United Stated aged between 5 and 17 years, the age range of the majority of those in the elementary and secondary school system at the beginning of an academic year.

Geographic reference: United States
Year: 2011/2012
Market size: 49,255,742 students, 61.4% of whom were elementary level students and 38.6% secondary school level students.
Source: “Highlights Table 1. 2011–12 versus 2010–11: Estimates for 50 States and D.C. Statistics of Public Elementary and Secondary School Districts,” page 66, Rankings & Estimates, a report by the National Education Association (NEA) dated December 2011, available online here. The population figure mentioned above is from a U.S. Census Bureau report, available here.
Original source: NEA
Posted on September 4, 2012

Electronics Stores

Our graph from Census Bureau data

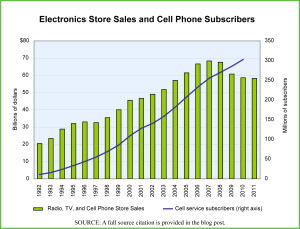
While working on an analysis of the retail and wholesale sectors of the U.S. economy, a somewhat surprising things emerged. The four fastest growing categories of bricks-and-mortor stores, based on annual growth rates from 1992–2010 were: (1) Used Car Dealerships, (2) Health and Personal Care Stores, (3) Pharmacies and, (4) Radio, TV, and Other Electronics Stores. The last of these surpirsed us a bit, given the fact that such a large portion of the sale of electronics has moved online and the fact that the demise of a prominent player in the sector, Circuit City, seems pretty fresh in the mind.

As it turns out, the important trend behind the strength of this retail sector is the rise of cell phones and all the new cell phone stores that one sees in shopping centers and strip malls across the United States. Cell phone stores are part of the category “Radio, Television and Other Electronics Stores” (NAICS 443112), the fastest growing of sectors in the overall Electronics and Appliance Retail industry (NAICS 443).

The graph shows annual sales from Radio, TV, and Cell Phone Stores in the United States from 1992–2011 and cell phone subscription figures for the period 1992–2010.

Geographic reference: United States
Year: 1992 and 2011
Market size: $20.5 billion and $58.3 billion respectively
Source: Annual Retail Trade Survey 2010, with updates from the Monthly Retail Trade Report series, available online here. The cell phone subscriber data are from the Statistical Abstract of the United States 2012, Table 1149, available from here.
Original source: U.S. Department of Commerce, Bureau of the Census
Posted on August 21, 2012
Vitamin Sales

Today’s market size comes from a report about U.S. vitamin purchases published by a consumer analytics firm. The report goes into some detail about where people make purchases of vitamins and how that has been changing over the past few years.

Geographic reference: United States
Year: 2012
Market size: $12.2 billion
Source: “Vitamin Market Survey Sees Buyer Deficiency,” Progressive Grocer, August 3, 2012, available online here.
Original source: TABS Group
Posted on August 20, 2012

Furniture Stores

Furniture Stores sales, annually, graphed

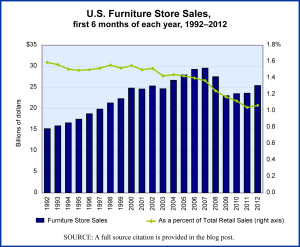
The sale of furniture—through furniture stores—in the United States has begun to recover from the significant hit it took as a result of the housing bubble collapse and the recession of 2007–2009. The graph we present here shows sales receipts for all furniture stores in the United States during the first six months of each year from 1992 through this year. The NAICS code (North American Industrial Classification System code) for furniture stores as measured here is 4421.

Geographic reference: United States
Year: 2007 and 2012 (first 6 months)
Market size: $29.6 billion and $25.4 billion respectively
Source: Annual Retail Trade Survey 2010, and updates from the Monthly Retail Trade Reports from the same reporting series, U.S. Census Bureau, available online here.
Original source: U.S. Department of Commerce, Bureau of the Census
Posted on August 17, 2012

Better Burger Restaurants

The better burger restaurant market is defined as establishements that make bugers to order with fresh ingredients, in particular fresh meat. Examples of the sorts of restaurants that are counted as better burger restaurants include Red Robin Gourment Burgers, Five Guys Burgers and Fries, and Bagger Dave’s.

Although the market for better burger restaurants is still miniscule compared to the $200 billion fast-food and fast-casual burger restaurant market, sales growth exceeded growth in the fast-food and fast-casual burger restaurant market in 2010. Sales growth for better burger restaurants was 21% compared to a 3.2% growth rate for fast-food and fast-casual burger restaurants. Better burgers are often made with fresh Angus beef, better-quality buns, premium cheeses, and homemade condiments. Some better burger restaurants also offer turkey burgers and veggie burgers. Data represent restaurant sales in 2011.

Geographic ref.: United States
Year: 2011
Market Size: $2.2 billion
Source: Davis, Scott, “Building a Better Burger: Mid-Michigan Opens Wide for ‘Better Burger’ Market,” Lansing State Journal, August 12, 2012, page 1E
Original Source: Technomic
Posted on August 14, 2012