Silica Sand for Hydraulic Fracturing

Sand

Yesterday’s post on the size of the world market for silica sand got us to thinking. So, we dug around in the U.S. Geological Survey’s Minerals Yearbook, to see if we could clearly see any trends in the use of silica sand in the United States. What we found was clear indeed and we present it here in a graph.

Overall, silica sand consumption has increased 62% from 2000 to 2011. The use of silica sand by the petroleum industry, for hydraulic fracturing, has grown 1,674%. The use of silica sand in oil and gas fracing operations was a relatively steady 5% of the overall demand for decades and began to rise in the mid 2000. By 2011, it reached 56% of total demand for silica sand in the United States. Final data on 2012 are not yet available but all signs show that the trend seen in the graph has continued apace.

Today’s market size is the value of silica sand used in oil and gas hydraulic fracturing operations in the United States in 2001 and in 2011.

Geographic reference: United States
Year: 2001 and 2011
Market size: $47.5 million and $1.33 billion respectively
Source: Thomas P. Dolley, “Silica [Advanced Release]” Tables 1 and 6, 2011 Minerals Yearbook, March 2013, pages 66.1-66.10, USGS, available in PDF format here. Data from Tables 1 and 6 of the Silica chapter of each annual Minerals Yearbook from 2000 through 2010 were used and may be accessed at the USGS web site here.
Original Source:U.S. Department of the Interior, U.S. Geological Survey (USGS)
Posted on January 31, 2014

Silica Sand

Sand is made up, primarily, of very small quartz (silicon dioxide, or SiO2) crystals. Quartz is one of the most common minerals found in on the Earth’s surface, so it is both an easily found mineral and one we use in many, many ways. Sand is used: in water filtration; in glass manufacturing; in industrial casting; as an abrasive in many applications; in producing concrete; in adding texture to slick roads, and as a filler in children’s sand boxes. Silica sand, however, has a higher price than the sand usually used to help on de-icying roads and making concrete. This is because it is a purer sand, having the composition and grain-size distribution required for industrial applications. Silica sand has well-rounded, consistently sized granules of almost pure quartz grains.

The demand for silica sand has been rising steadily for years now. Globalizations—if you will forgive such a sweeping generalization—is one of the main reasons, as is the increased demand worldwide for glass (think HD TVs, tablets and cell phones), and the significant increase in the use of hydraulic fracturing in the oil and gas industry. The hydraulic fracturing process for oil and gas extraction takes a mixture of silica sand (often called frac sand), water and chemicals and injects this mixture into a well under very high pressures. Small cracks form in the bedrock and the sand in the mixture helps to prop open these tiny fissures. From the fissures, conduits form that increase the flow of fluids and gas within the well.

Today’s market size is the value of silica sand sold worldwide in 2011 and a forcast for its value in 2016.

Geographic reference: Worldwide
Year: 2011 and a forecast for 2016
Market size: $6 billion and $9.2 billion respectively
Sources: (1) World Industrial Silica Sand, a brochure to promote an industrial study produced by The Fredonia Group and published in October 2012. The brochure is available online here. (2) “Industrial Silica Sand FAQs,” Minnesota Department of Natural Resources, last updated on October 31, 2012 and available here.
Posted on January 29, 2014

Craft Cider

red_apples_on_tree_193814

Sales in the United States of hard cider tripled between 2007 and 2012. Hard cider is a fermented alcoholic beverage made with fruit juice, usually apple but some ciders are made with other fruit juices, primarily peach and pear. When the term cider is used alone, it may refer to hard cider or to a nonalcoholic apple cider.

Although the hard cider market is still a small fraction of the $10.2 billion craft beer market (2012) it is growing quickly. Cider sales in multi outlets and convenience stores during the year ended March 24, 2013 totaled $122.5 million for the top 20 cider brands. That’s an increase of 97 percent compared to a year earlier. Capitalizing on the craft cider trend, small and large craft beer manufacturers are creating their own hard cider blends to entice drinkers with new taste offerings. To spark interest in the mainstream beer drinker MillerCoors offers several hybrid beers.

Today’s market size is total sales of hard cider in the United States in 2012.

Geographic reference: United States
Year: 2012
Market size: $600 million
Source: Chris Furman, “Craft Cider Gaining Momentum,” Brewhound, June 3, 2013, available online here. The photo is from a web site offering images free of copyright, here.
Posted on January 24, 2014

Training Doctors

The education and training of a doctor is a long and costly endeavor. First comes the classroom education, the cost of which is picked up, for the most part for those not fortunate enough to get a scholarship, by the future doctor him or herself. Then comes a final on-the-job training period in which doctors with new diplomas spend four or more years working in a residency program.

During this residency, doctors in training see and treat patients under the supervision of more seasoned physicians. Most of these residency programs are carried out in so called teaching hospitals, which account for approximately 20% of the nation’s hospitals. Residency programs are arduous. Residents are expected to routinely work 80 hours a week and they are paid half or far less of what they will receive for much the same work after the residency. This training is expensive for the system as a whole and has been, for all practical purposes, nationalized.

The U.S. federal government pays for most of this training with money from the medicare and medicaid systems. Our market size today is the money spent by the federal government annually to support this graduate medical education.

Geographic reference: United States
Year: 2012
Market size: $11.5 billion of U.S. government funds are used to support residency slots in training hospitals, approximately 115,000 in 2012
Source: Catherine Dower, “Graduate Medical Education,” a health policy brief published in Health Affairs, on August 31, 2012 and available online here.
Original Source: U.S. Department of Health and Human Services, Center for Medicare and Medicaid Services
Posted on January 22, 2014

Spending on Water and Sewer

Water-Sewer

One of the basic infrastructural needs of any modern society, particularly one in which the density of population is great, so, urban areas, is that which supplies clean water and carries waste away. It is one of those things that in modern industrial society we take very much for granted and almost don’t notice it, until something isn’t working.

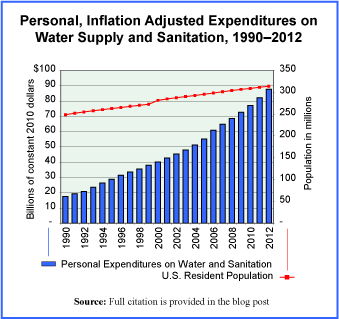
Today’s market size is the amount spent by U.S. residents, in the United States, for water supply and sanitation in 1990 and again in 2012. This does not include the expenditures of companies or other entities for water and sewer services but is, rather, the total spent by individuals for personal use. The graph provides an year-by-year picture of these expenditures in constant 2010 dollars, in other words, in inflation adjusted terms. A red line on the graph is there to show how the population has risen over this period and it is clearly at a rate much slower than the rate of growth in expenditures on water.

Geographic reference: United States
Year: 1990 and 2012
Market size: $27.1 and $85.9 billion respectively (in current dollars)
Source: “Table 2.5.5 Personal Consumption Expenditures by Function (A),” National Income and Product Accounts Tables, (NIPA), Bureau of Economic Analysis, August 7, 2013, available from the BEA web site here.
Original Source: U.S. Department of Commerce, Bureau of Economic Analysis
Posted on January 20, 2014

Youth Sports Tourism

An estimated 35 million children in the United States between the ages of 5 and 18 play organized sports every year. Of those, 21 million play non-school youth sports, which include baseball, soccer, lacrosse, rowing, hockey, volleyball, and gymnastics. These non-school groups are organized through local programs, such as Little League, or through sports clubs.

Unlike school-sponsored sports, in which teams usually travel by bus from one local school to another for games and tournaments, non-school sports games and tournaments may be held either across town or across the country. Parents are expected to spend the time and money to take their children to these events. Because of the money families spend while at these far away locations, more cities are planning to build sports complexes to attract youth sports tournaments.

Today’s market size is an estimate of the total spent in 2013 by families in the United States on travel for youth sports, including hotels, restaurants, and shopping. This category of tourism—Youth Sports Tourism—didn’t even exist a few years ago but is now one that is keenly tracked by industry observers and chambers of commerce.

Geographic reference: United States
Year: 2013
Market size: $7 billion
Source: Mark Koba, “Spending Big on Kids’ Sports? You’re Not Alone,” CNBC.com, January 13, 2014, available online here.
Original Source: Minnesota Amateur Sports Commission
Posted on January 16, 2014

Spending on Internet Access

Today’s market size is the amount that was spend in the United States on Internet access in 2005 and in 2012. The increased spending from 2005 to 2012, after inflation, was 154% while the increased penetration of Internet access as a percent of the U.S. population grew by only 20% (from approximately 68% to 81%). Clearly, the ways in which we are accessing the Internet have gotten more expensive, as, most likely, have the speeds with which that access is being made.

Geographic reference: United States
Year: 2005 and 2012
Market size: $29.7 billion and $80.7 billion respectively
Sources: (1) “Table 2.4.5 Personal Consumption Expenditures by Type of Product,” National Income and Product Accounts Tables, (NIPA), U.S. Bureau of Economic Analysis, August 7, 2013, available from the BEA web site here. (2) “Percent of Individuals Using the Internet 2000–2012,” ITU, available here.
Original Source: U.S. Department of Commerce, Bureau of Economic Analysis, International Telecommunications Union (ITU), Federal Communications Commission (FCC)
Posted on January 14, 2014

Farms

Farms

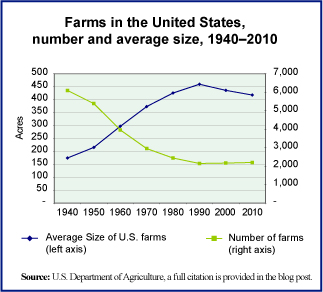
It takes far fewer acres to produce the food we need and in the United States the acres used in agriculture have been shrinking for decades, while output has grown. The number of farms has also been shrinking as larger and more industrial-sized farms have come to dominate the market.

These trends in farming can be seen in the graph. It shows the number of farms and average size of U.S. farms each decade since 1940. What we thought was of interest is the fact that there has been a small change in the century-long trend of growing average farm size. Since 1990, the average size of farms has actually shrunk, slightly, from 460 acres to 418 acres. There was also a slight increase in the number of farm between 2000 and 2010. The relatively small movement back to family or small-scale farming, and in particular organic farming, is large enough to be visible in the national statistics and on the size of the average farm in the United States.

Today’s market size is the total number of farms in the United States in 1990 and 2010 as well as the total value of farm output in those two years.

Geographic reference: United States
Year: 1990 and 2010
Market size: 1990: 2,146 farms with output valued at $180 billion
Market size: 2010: 2,201 farms with output valued at $300 billion
Sources: (1) “Table 824. Farms—Number and Acreage: 1990 to 2010,” Statistical Abstract of the United States: 2012, page 536, December 2011, U.S. Census Bureau, available online here. (2) “Table 1101. Farms—Number and Acreage: 1959 to 1989,” Statistical Abstract of the United States: 1990, page 638, January 1990, U.S. Census Bureau. (3) “Series K 1-16. Farm Populations, Land in Farms, and Value of Farm Property and Real Estate: 1850 to 1970,” Statistical Abstract of the United States: 2012, page 457, September 1975, U.S. Census Bureau.
Original Source: U.S. Department of Commerce, Bureau of the Census
Posted on January 10, 2014

Charter Schools

The National Education Association defines charter schools as follows: “Charter schools are publicly funded elementary or secondary schools that have been freed from some of the rules, regulations, and statutes that apply to other public schools, in exchange for some type of accountability for producing certain results, which are set forth in each charter school’s charter.” The first charter school was established in Minnesota in 1991 as a part of ongoing educational reform efforts and more specifically, an expansion of market-based school reform. Proponents of charter schools claim that they bring much needed entrepreneurial spirit and a competitive ethos to public education. Opponents claim that to outsource the running of public schools to private entities is to redirect already scarce resources to service fees and profits while creating new layers of administration.

Since the first charter school was established in Minnesota, 40 additional states have passed legislation permitting the formation of charter schools and the number of such schools has grown with each passing year. The formation of Education Management Organizations (EMOs), both nonprofit and for-profit, has been one result of the legislation enabling charter schools. Some EMOs are now quite large, managing dozens of schools while others manage a single school. The diversity of this category of management companies is quite extreme. While not all charter schools are operated by EMOs, in the academic year 2011-12 such EMOs accounted for approximately 39% of all charter schools and 50% of all students enrolled in charter schools. And of the nearly one million students enrolled in EMO run schools that year, 51% were enrolled in for-profit EMOs.

Today’s market size is the total number of charter schools operating in the United States in the academic years beginning in 2000 and 2010. While charter schools still make up a very small percentage of all public schools in the country (5.3%), it is an area that some people feel holds great promise for further privatization of government services.

Geographic reference: United States
Year: School year starting in the fall of 2000 and 2010
Market size: 1,993 and 5,274 respectively
Sources: (1) “Charter Schools,” a fact sheet on the National Education Association web site from which we quote the definition of these schools, available online here. (2) Gary Miron and Charisse Gulosino, Profiles of For-Profit and Nonprofit Education Management Organizations, November 2013, National Education Policy Center, available online here. (3) Tables 71, 98, and 161 from chapter Two of the Digest of Education Statistics: 2012, published by the NCES in 2013 and available online here.
Original Source: U.S. Department of Education, National Center for Education Statistics (NCES); National Education Policy Center, Commercialism in Education Research Unit (CERU)
Posted on January 8, 2014

Independent Bookstores

Bookstores

A recent article titled “Independent bookstores turn a new page on brick-and-mortor retailing,” by Michael Rosenwald and published on the Washington Post.com web site, here, grabbed our attention. It appears that after years of shrinking, idependent bookstores may have hit bottom. In fact, there are some signs of growth as new independent store openings may be outpacing closures.

As we learned some years ago when we did a study of the publishing industry, getting reliable statistics on the national book retailing industry is not easy. This is in part because it is always difficult to track an industry that is going through significant change and reorganization. The selling of books definitely falls into that category. Over the last two decades it has been a standout in this regard within an entire sector—the retail sector—going through significant change. From the rise and fall of the big bookstore chains such as Borders and Barnes and Noble to e-books, Amazon and the spread of books into a growing number of big box, discount outlets, independent booksellers have seen their share of the business shrink for decades.

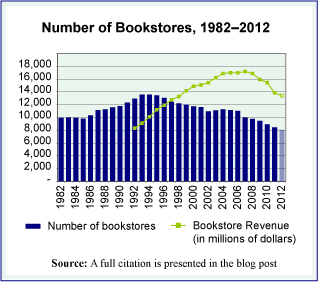
The graph we offer shows the total number of bookstores in the United States, annually, over a three decade period. It also shows industry revenues for the last twenty years of that period. The data charted all come from the U.S. Census Bureau’s reports on the industry and their County Business Patterns database. While total bookstore numbers are available, it is more difficult to tease out of these data the store count by independent bookstores versus the larger stores run by big chains that began to dominate the industry in the 1990s. The graphic fails entirely to capture the rise of e-books and e-commerce. Nonetheless, it provides an overview of the pattern made by the ups and downs of the bricks-and-mortar bookstore.

From these overall figures we can make educated estimates a few things. By taking data from the Annual Reports of three of the largest bookselling chains, Borders (until 2011), Barnes and Noble, and Books-A-Million, we have calculated the following rough outline of Independents versus chains in 2002 and a decade later, in 2012. In 2002, the three largest chains accounted for 21% of all bookstores and 49% of bookstore sales. In 2012, after the bankruptcy of Borders, the remaining two large chains accounted for approximately 20% of the stores and 57% of all the sales made by bookstores.

Today’s market size is the approximate number of independent bookstores and small chain bookstores in the United States in 2012 as well as the value of their sales in that year.

Geographic reference: United States
Year: 2012
Market size: 6,043 bookstores with revenues of approximately $5.76 billion (based on Census data on bookstore sales, less sales by the two largest chains, Barnes & Nobel and Books-A-Million)
Sources: (1) Gabe Habash, “Bookstores in America, 2013: A State-by-State Guide, Publishers Weekly, June 1, 2013, available online here. (2) Latest Annual Retail Trade Reports, part of the Census Bureau’s monthly and annual compilation of data on the retail sector, taken from the web site here and more specifically, the report titled Annual Retail Trade Survey—2011: Sales (1992-2011) using monthly reports to update the annual figure for 2012.
Original Source: U.S. Department of Commerce, Bureau of the Census, the American Booksellers Association, and Publishers Weekly
Posted on December 30, 2013