Used Cars in China

The auto market in China, like most markets, is growing rapidly. Demand for cars has been growing annually as the purchasing power of millions of Chinese people increases as that country becomes an economic power house. But because the mass market for automobiles in China is relatively new—having taken off in earnest starting four or five years ago, according to the first source listed below—a used car market is an even newer thing in China. It takes, on average, four years for a new car to be traded in for an “upgrade” and thus become available for resale as a used car.

Today’s market size is the estimated number of used cars sold in China in 2012 as well as a forecast for the number of used cars that will be sold in 2016 and 2020. For comparison purposes, let us point out that in the United States in 2012, used car sales were nearly three times as great as new car sales whereas in China, used car sales were only one-third the number of new car sales. The used car market in China is very young, with lots of room to grow.

Geographic reference: China
Year: 2012 and forecasts for 2016 and 2020
Market size: 4.8, 10.0 and 20.0 million respectively
Sources: (1) Kelvin Chan, “Auto Sales Boom Spawns a Growing Used Car Market in China,” Detroit Free Press, November 27, 2013, available online here. (2) Cliff Atiyeh, Used-car Sales Climb as Americans Hold Onto Older Vehicles,” MSN.com, February 4, 2013, available online here.
Original Source: Changan Ford, the U.S. company’s China joint venture
Posted on December 11, 2013

Apprenticeships

YouthUnEm

Apprenticeship programs have been around for centuries. In the most basic sense, an apprentice is somebody learning the skills of a particular trade by working with a skilled worker. In industrialized countries, apprenticeship programs vary greatly from regulated arrangement between private companies and schools and/or trade unions to less formal arrangements in which a person new to a field of endeavor works along-side somebody already skilled in that field. Most apprenticeship programs include classroom work as well as on-the-job training.

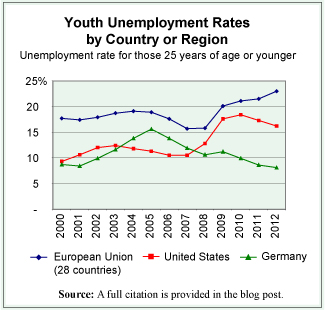
There are many things that play a role in the fluctuations of unemployment rates and these rates tend to be higher for younger people than for those more established in their work lives. Thus, having a youth population that is well trained for the jobs that are available seems a natural aid to keeping the youth unemployment rate down. From the data available on countries of the European Union—where the prevalence of apprenticeship programs is greater than in the United States, although it does vary from country to country—there seems to be a discernible connection between lower youth unemployment rates and the prevalence of robust apprenticeship programs. By way of comparison, we offer the graph that shows the youth unemployment rate for the first decade of the current century for the European Union, for Germany, and for the United States.

While the youth unemployment rate in the European Union as a whole, in 2012, was 23% it ranged widely from a low of 8.1% in Germany to a high of 55.3% in Greece. Interestingly, the two European countries with the lowest youth unemployment rate are also two of the countries in the Union with the most robust apprenticeship programs, Germany and Austria.

In the United States, apprenticeship programs are not as heavily used as they are in Europe. Trade unions use to be a primarily source of such programs in the United States but with the decline in union membership over the last decades these programs have also been in decline. That is until recently. European companies are starting to establish apprenticeship programs in the United States to train the workforce they need for their U.S. facilities.

Today’s market size is the number of people in the United States participating in apprenticeship programs that are registered with the U.S. Department of Labor. The approximate number participating in such programs in Germany is also provided.

Geographic reference: United States and Germany
Year: 2012
Market size: United States: 358,000 (with an additional, approximately 450,000 involved in programs not registered with the Department of Labor)
Market size: Germany: 1.6 million
Sources: (1) “Registered Apprenticeship National Results,” U.S. Department of Labor, Employment and Training Administration, June 7, 2013, available online here. (2) Unemployment Rate by Age Group,” Eurostat, October 31, 2013, available online here. (3) “Apprenticeships: Earn while you learn,” Bureau of Labor Statistics, Summer 2013, available online here.
Original Source: U.S. Department of Labor and Eurostat
Posted on December 2, 2013

Cranberries

Cranberries, a native fruit of North America, are consumed most frequently in the form of juice. However, during the celebration of Thanksgiving in the United States, cranberries in a more solid form have an important place on the menu. Wisconsin is the cranberry-producing center of the United States. It’s crop, in 2012, accounted for more than half of all fresh cranberries sold in the country.

Today’s market size in the estimated value of the 2012 cranberry harvest in the United States.

We wish you much to be thankful for on this day before Thanksgiving, 2013.

Geographic reference: United States
Year: 2012
Market size: $386 million (slightly more than 8 million barrels of cranberries)
Source: Malinda Geisler and Diane Huntrods, “Cranberries Profile,” Agricultural Marketing Resource Center (AgMRC), Iowa State University, available online here.
Original Source: U.S. Department of Agriculture
Posted on November 27, 2013

Roundabouts

Roundabout

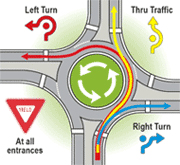
Roundabouts are a road design used to replace a traditional four or six-way intersection, referred to as a crossroads intersection, with a circular path around which traffic flows, continuously, in one direction. The graphic provides an overview of such a roundabout.

For a driver not accustomed to this sort of intersection, a roundabout may be disconcerting at first. However, study after study shows that in the right locations roundabouts are an improvement over more traditional crossroad intersections in two ways, by increasing the flow of traffic and by reducing (by 76%) the number of injury producing accidents. The reduction in accidents leading to fatalities in a roundabout versus a crossroad intersection is even greater since speeds are reduced throughout the intersection. According to the U.S. Department of Transportation, there are 90% fewer fatal accidents in crossroads intersections that have been replaced by roundabouts.

Today’s market size is the estimated number of roundabout intersections worldwide, in 1997 and in 2012.

Geographic reference: World
Year: 1997 and 2012
Market size: 35,000 and 60,000 respectively
Source: “The Widening Gyre,” The Economist, page 16, October 5, 2013. The graphic comes from a Michigan Department of Transporation web site, here.
Original Source: U.S. Department of Transporation
Posted on November 25, 2013

Methamphetamine Laboratory Cleanup

MethLabs

The societal costs of the methamphetamine—crystal meth or simply meth for short—drug business, if we can call the trade in this illegal drug a business, is very difficult to calculate. It negatively impacts the health and welfare of the participants and the communities in which it is most active. These tend to be rural communities located in the mid-section of the country. The states fighting the largest battles with the meth trade are Missouri, Tennessee, Indiana and Kentucky.

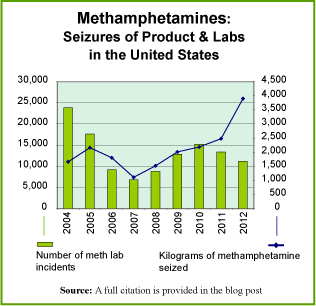
The graph shows the number of methamphedamine laboratory incidents reported by the Drug Enforcement Administration (DEA) over the period 2004–2012. An incident is any seizure of a meth lab, a dump site or stashes of chemical and glassware. The graph also shows the quantity of methamphetamine seized by the DEA over this period.

There is one cost associated with the meth trade, of so many costs to society, that has been a stimulus to a legal business activity. That is the cost of cleaning up clandestine laboratories in which this drug is produced, or cooked in the vernacular of this trade. The methods used to make this drug also produce a lot of hazardous fumes and byproducts. Therefore, meth labs must be handled carefully and then thoroughly cleaned up after a seizure. The cost of such cleanups depends greatly on the size of the facility but it can run anywhere from $1,000 per site to $25,000 per site or even more in some extreme cases. Specially certified waste management firms and environmental consulting firms are contracted to carry out this cleanup work.

Today’s market size is the estimated amount spent in the United States cleaning up meth labs in 2012. Worth noting is the fact that this money was concentrated in the ten states in which most meth trade occurrs. Together these ten states represent 82.4% of all meth lab incidents. For more details on which states have the highest level of meth activity, go to the DOJ web site listed as the third source below.

Geographic reference: United States
Year: 2012
Market size: $29 million
Sources: (1) Jonah Engle, “Merchants of Meth,” Mother Jones, page 33, July/August 2013. (2) “DEA Domestic Drug Seizures,” part of a U.S. Department of Justice web site available online here. (3) “Methamphetamine Lab Incidents, 2004–2012,” another DOJ offering on its web site here.
Original Source: U.S. Department of Justice
Posted on November 22, 2013

Catastrophe Bonds

Catastrophe bonds, or cat bonds, are bonds sold by an entity wishing to reduce its liability in the face of catastrophic loses such as the ones being caused by the seemingly increasingly violent natural storms occurring around the world. The market for cat bonds has been strong and growing as both the need for risk mitigation has risen as have the number of large investors searching for lucrative investment opportunity in an era of low interest rates.

An example of a cat bond is one issued by New York City’s transit authority in the aftermath of Superstorm Sandy. When insurance carriers, reeling from the costs associated with that storm, hesitated to underwrite the risk of future water surges, the transit authority issued a catastrophe bond in the amount of $200 million. The money will be used to repair damage to the subway system in the event of another flooding storm that reaches the same levels as Sandy within the next three years. If there is no serious storm within that period of time, the money will be returned to investors with an interest payment that—in 2012 for cat bonds—was running at 11% over the rate for Treasury Bills.

Today’s market size is the total value of catastrophe bonds outstanding as of October 1, 2013, worldwide.

Geographic reference: World
Year: 2013
Market size: $19 billion (up from $4 billion a decade ago)
Source: “Perilous Paper,” The Economist, pages 76-77, October 5, 2013.
Original Source: Swiss Re Capital Markets
Posted on November 20, 2013

Telephone Service: Landline versus Wireless

PhoneServiceMI

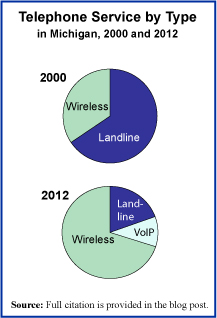
The past decade has been one of great changes in the telephone service landscape. As investment has been made in the wireless infrastructure, cell phone coverage has become much more reliable. With growing reliability of cell phones has come the option for many to do away with one’s landline phone service. The pie chart on the right shows this clearly. In the State of Michigan the decline of landline accounts and the rise of wireless accounts has been significant since the turn of the century. For the year 2012, the graph includes a count of the users of a system called VoIP, which stands for Voice over Internet Protocol and is a telephone-like service offered to those with access to highspeed Internet connections.

There is now legislation pending in the State of Michigan to allow landline telephone service providers to begin discontinuing service to customers, after a 90 day notice, starting in 2017. This legislation would, in essence, do away with the legal right to have access to landline phone service at almost any address in the United States, a right that dates back to the early 1910s and was updated most recently in the FCC Telecommunications Act of 1996.

Michigan would not be the first state to pass such legislation. Similar laws have already passed in other states like Texas, Florida and North Carolina. As the landscape for telephone service changes, one can not help but worry about those in areas not well covered by alternate phone service options. While wireless coverage has improved significantly over the years it is not yet near universally accessible and many people still depend upon landline service for dependable telephone connectivity.

Today’s market size is the number of phone service accounts, regardless of type—landline, wireless cell service, and/or VoIP—in the State of Michigan in 2000 and 2012. Worth noting is the population of the State in Michigan in those two years; 9.94 million and 9.88 million respectively (yes, Michigan did actually lose population over this period). Thus, the number of telephone service accounts per capita has risen over this period from 1.03 to 1.35.

Geographic reference: Michigan
Year: 2000 and 2012
Market size: 10.2 million (66% of which were landline accounts) and 13.3 million (20% landline accounts) respectively
Sources: (1) Kathleen Gray, “Still have a landline? Proposed Michigan legislation could spell the end by 2017,” Detroit Free Press, November 18, 2013, available online here. (2) David Cay Johnson, “Phone Service for All, No Matter What Kind,” Reuters, March 28, 2012, available online here. (3) “State & County QuickFacts—Michigan,” an extract of Census Bureau data on population statistics made available on the Census web site here.
Original Source: U.S. Federal Communications Commission and the U.S. Census Bureau
Posted on November 18, 2013

Automotive Semiconductors

Semiconductors—the essencial foundation upon which modern electronics rest—are found in all electronic devices as well as many products that one would not initially think of as electronic, such as greeting cards with embedded audio chips in them to produce music upon opening. The use of semiconductors in the automotive industry has made the modern car/truck one of the most advanced electronic devices most people own, often without even knowing it.

Semiconductors are, in the simplest terms, elements like germanium and silicon that conduct electricity at only moderate rates, thus they are “semi” conductors. These elements are used to make the semiconductor chips that are embedded in electronic devices to allow the use of electrical currents as a signal. All cybernetics rely on this type of signaling.

Today’s market size is the estimated value of the automotive semiconductor market, worldwide, in 2012 (when it represented 8.1% of the total world semiconductor market) and a projection of the market’s value in 2020.

Geographic reference: World
Year: 2012 and a projection for 2020
Market size: $23.4 billion and $33.5 billion respectively
Sources: (1) Gary S. Vasilash, “The Supercomputer in Your Garage,” Car and Driver, page 34, December 2013. (2) Monique D. Magee, editor, “Semiconductors,” Market Share Reporter: Trends Over Time, page 553, GALE Cengage Learning, 2012.
Original Source: Strategy Analytics
Posted on November 15, 2013

Home Health Care Services

With an aging population it will come as no surprise to most people that the home health care services industry has seen steady growth over the last decades and is forecast to see continued growth well into the next decade.

Today’s market size post is the revenue earned in 2002 and 2012 by all firms with employees in the business of providing home health care services in the United States. This industry [NAICS 6216] is defined as followed by the Census Bureau; “This industry comprises establishments primarily engaged in providing skilled nursing services in the home, along with a range of the following: personal care services; homemaker and companion services; physical therapy; medical social services; medications; medical equipment and supplies; counseling; 24-hour home care; occupation and vocational therapy; dietary and nutritional services; speech therapy; audiology; and high-tech care, such as intravenous therapy.”

Geographic reference: United States
Year: 2002 and 2012
Market size: $30.39 billion and $66.07 billion respectively
Sources: (1) “Table 8.1. Health Care and Social Assistance (NAICS 62)—Estimated Revenue for Employer Firms: 2002 Through 2010,” Service Annual Survey 2010, February 2012, page 151, available online here. (2) “Table 1 – Selected Services Estimated Quarterly Revenue for Employer Firms Fourth Quarter 2003 Through Fourth Quarter 2012,” Annual Benchmark Report for Services through 2012, a link to which is available on the U.S. Census Bureau’s web site, here.
Original Source: U.S. Department of Commerce, Bureau of the Census
Posted on November 13, 2013

U.S. Veteran Population

Veterans2

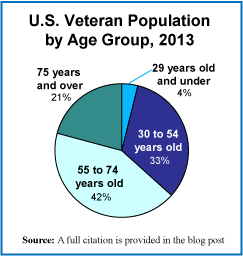
Today we present a brief market size post on the U.S. Veteran Population, in honor of those veterans on this Veteran’s Day. The pie chart shows the population broken down into four age groups. While the total number of veterans has been declining for many decades now, the number of veterans living with a service-connected disabilities has been rising. Between 1990 and 2012, the number of veterans with service-connected disabilities grew by 46%.

Geographic reference: United States
Year: 2013 and a projection for 2020
Market size: 21,972,964 and 19,604,276 respectively
Sources: (1) “Table 1L: VETPOP2011 Living Veterans by Age Group, 2010-2040,” a statistical table made available by the U.S. Department of Veterans Affairs on their web site here, towards the bottom of the page on the right side. (2) “Trends in the Utilization of VA Programs and Services,” prepared by the National Center for Veterans Analysis and Statistics, January 2012, available online here.
Original Source: U.S. Department of Veterans Affairs
Posted on November 11, 2013