Cement

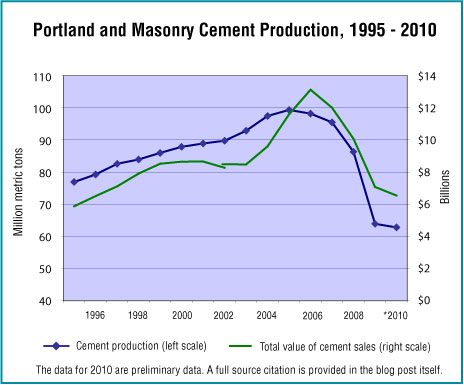
Cement Production Graph

A decade plus worth of production data on the cement industry shows a pattern with which we are familiar, the build-up and crash of the housing market. Most of the construction materials industries have seen similar patterns of growth and decline in the 2000s. Early data on 2010 show that sales of cement in that year reached a 27 year low, falling 45% (59 million metric tons) off the high reached in 2005.

The market size presented below is the number of metric tons of portland and masonry cement produced in the United States in 2010 and the approximate value of that cement if shipped from the mill the same year.

Geographic reference: United States
Year: 2010
Market size: 62.8 million metric tons with an approximate value of $5.7 billion
Source: “Cement,” part of an annual series titled Mineral Commodities Summaries, published by the U.S. Geographical Survey and available online here.
Original Source: U.S. Department of the Interior, USGS
Sodium Sulfate

Sodium sulfate is an inorganic chemical that looks like a white powder. Its chemical symbol is NA2 SO4. Sodium sulfate is used in the production of many products. Soaps and detergents account for the largest single share (35%) of its consumption. Other end uses of sodium sulfate include glass manufacturing which accounts for 18% of consumption, the paper and pulp industry uses 15%, and textile production account for 4% of consumption in the United States. The remaining 28% of consumption is divided among many smaller consuming end users.

The market size presented below is the estimated total value of all natural and synthetic sodium sulfate sold in 2010.

Geographic reference: United States
Year: 2010
Market size: $42 Million
Source: “Sodium Sulfate Statistics Information,” part of an annual series titled Mineral Commodities Summaries, published by the U.S. Geographical Survey and available online here.
Original Source: U.S. Department of the Interior, USGS
Barges

Our thoughts turn to those living along the nation’s riverways as news of rising waters and extensive flooding are coming in from all over the Midwest and East Coast. The inland and intercoastal waterway as an important transportation highway then comes to mind, a highway on which hundreds of millions of tons of cargo move annually valued at over $75 billion. Much of this cargo is moved in barges—non self-propelled vessels—much like rail cars for the waterway system. Barges are tied together and moved through the system by tow boats. Barges are the most energy efficient way to move things. On a ton-mile per gallon basis, (miles per gallon carrying one ton of cargo) trucks get 155 miles, rail transport gets 413 miles and inland towing gets 576 miles per gallon.

Geographic reference: United States
Year: 2008
Market size: 32,052 barges
Source: “TABLE 2: Summary of the United States Flag Passenger and Cargo Vessels Operating or Availalble for Operation by Year,” Watreborne Transporation of the Untied States, November 16, 2009, available online here. Energy costs per mode of transportation data comes from a report put out by the Kentucky Association of Riverports, available online here. Another Army Corp of Enginners report, titled Inland Waterway Navigation, Value to the Nation, highlights many interesting facts about the inland waterway, including how water transportation compares with other modes in terms of efficiency. It is available online here.
Original Source: U.S. Army Corp of Engineers

Digital Publishing Market

UK books

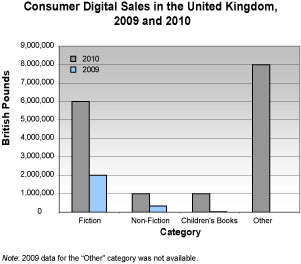
Data show combined digital sales in the United Kingdom, including academic, professional, school, and consumer digital downloads and e-books. Academic and professional digital sales accounted for £84 million. Consumer sales, which includes fiction, non-fiction, and children’s books, were £16 million. Of that £16 million, e-book sales accounted for £13 million. The graph to the right breaks down consumer digital sales by category.

Geographic reference: United Kingdom
Year: 2010
Market size: £120 Million
Source: Philip Jones, “Digital Sales Now Worth 6%, as E-books Grow 300% in 2010,” TheBookseller.com, March 5, 2011 available online.
Original Source: Publishers Association

Librarian Corp

In an era which defines itself as the “Information Age,” it should come as no surprise that libraries have seen their
usage numbers increasing annually for a decade. Today’s market size looks at the Librarian Corp—number of librarians working as librarians in the United States in 2008 and forecasted to be working in 2018 based on projections by the Bureau of Labor Statistics.

Geographic reference: United States
Year: 2008 and 2018
Market size: 159,900 and 172,400 respectively
Source: “Librarians,” Occupational Outlook Handbook, 2010-2011 Edition, December 3, 2010, available on the BLS web site here.
Original Source: U.S. Department of Labor, Bureau of Labor Statistics

Pens & Markers

While we depend more and more on digital communications, the world of the pen and paper remains strong. Today’s market size is the size of the global market for pens and markers, from fine writing instruments to highlighters.

Geographic reference: World
Year: 2009
Market size: $18.5 Billion
Source: “Rubbermaid, Brands that Matter,” a report on the office products group of NewellRubbermaid, available online here.
Original Source: Global Industrial Analysts Report 2008 and 2009, Nielsen, GfK, customer POS data, and 2008 Prismacolor A&U Study

Cloud Computing

A term we hear quite often these days is cloud computing. The personal computer revolution was, in part, a step
away from what were then the large, centralized mainframe computers on which data was stored and accessed through workstations. With a personal computer one had everything on his or her own device. Now, in a way, there is a decoupling again of the data from the device. Cloud computing is, in the simplest terms, the use of a remote location, accessible through the Internet, to store the data and applications used on a computer—instead of a harddrive on the local computer or local network of computers.

This is a growing business but one whose boundaries are still being defined, which makes it difficult to measure. It is hard to keep the image of a person trying to measure a cloud coming to mind. Consequently, one can find many different size estimates for cloud computing, the differences usually having to do with how the market is defined. What we present here is an estimate of the revenue from business cloud services—hardware and software infrastructure as well as the leasing of space—so it does not include, for example, the services provided to people wishing to back-up their family photo albums. Cloud computing services to the individual is another large business and one that may be included in other estimates of the nebulous cloud computing market.

Geographic reference: World
Year: 2010 and forecast for 2014
Market size: $22.2 Billion and $55.5 Billion respectively
Source: Lohr, Steve, “The Business Market Plays Cloud Computing Catch-Up,” The New York Times, April 15, page B16
Original Source: IDC

Size of the Labor Force

Employment by sector

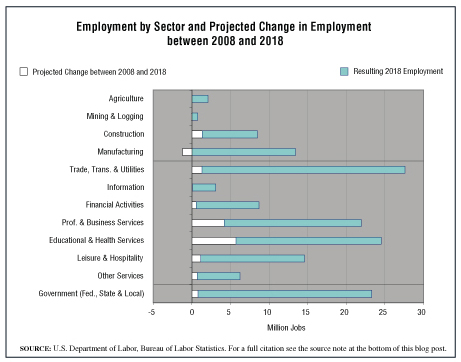
Today—in honor of International Labor Day, celebrated on May 1st around the world—we provide a market size for the U.S. labor force in both 2008 and 2018. The projected size of the labor force is just one of many interesting projections published in a work titled Occupational Outlook Handbook, published periodically by the U.S. Bureau of Labor Statistics.

Areas that are projected to see the greatest number of new jobs are the Healthcare and Social Assistance Sector (slightly more than 4 million jobs), the Professional, Scientific and Technical Services Sector (2.66 million jobs), and the Educational Services Sector (1.69 million jobs). The white segments of the bars on the graph show the number of jobs expected to be added between 2008 and 2018 for each major industry. When it looks as if there is no white segment for a particular industry’s bar, well, that means the number of new jobs projected is tiny, invisible at this range.

Geographic reference: United States
Year: 2008 and 2018
Market size: 136,800,000 and 166,900,000 respectively, an increase of 22%
Source: “Overview of the 2008-18 Projections,” Occupational Outlook Handbook, 2010-2011 Edition, December 3, 2010, available on the BLS web site here.
Original Source: U.S. Department of Labor, Bureau of Labor Statistics

BBC Funding

As a bit of a tip-of-the-hat to the royal wedding being celebrated today, we look at the company that will no doubt lead the rest in covering this event, the British Broadcasting Corporation, known around the world as the BBC. Today’s market size is the estimated total value of the annual licensing fee which is levied on every U.K. household that has a television set. This fee was established under law in 1922 and although controversial today, remains in place. The sum collected makes up approximately 80 percent of the BBC’s annual budget.

Geographic reference: United Kingdom
Year: 2010
Market size: £3.6 Billion (approximately $5.6 Billion based on the exchange rate at the end of 2010)
Source: Lyall, Sarah and Eric Pfanner, “The Beeb Is Struggling to Tighten Its Belt,” The New York Times, April 24, 2011, page B1.
Original Source: BBC

Cosmetic Surgery

In China, even a small percentage of the population can be a very large number. This may explain how, according to the source, China is now the third largest national consumer of cosmetic surgery when calculated by number of procedures performed annually. Today’s market size is the estimated value of cosmetic surgical procedures performed in China last year.

Geographic reference: China
Year: 2010
Market size: $2.3 Billion
Source: LaFraniere, Sharon, “For Many Chinese, New Wealth and a Fresh Face,” The New York Times, April 24, 2011, page 6
Original Source: Chinese Government estimates
Posted on April 28, 2011