Honey

The U.S. Department of Agriculture’s National Agricultural Statistics Agency (NASS) produces annual reports on individual commodities. One of the commodities they track is honey. The market sizes presented today are various years worth of honey production in the United States by producers that have at least 5 colonies of bees.

Geographic reference: United States
Year: 1990, 1993, 2003 and 2009, 2010
Market size: 196, 230, 181, 146 and 176 million pounds respectively
Source: “Honey,” February 2011, February 27, 2004, and February 18, 1994, Feburary 13, 1991. These annual reports are available online here.
Original Source: U.S. Department of Agriculture, NASS
Posted on April 11, 2011

Wood Containers & Pallets

The economy may be on the mend, slowly, but the severity of the recession that officially began in December 2007 and the specific areas that it hit hardest can now be studied in detail. Economic census data for 2009 are available from the U.S. Census Bureau, an agency whose work is too often undervalued and its value underestimated. Without a clear picture of what is truly going on in the economy, good decisions are hard to make.

We tip our hats to the U.S. Census Bureau and to all the federal agencies dedicated to the collection and compilation of statistical data.

Today’s market size item is based on the value of product shipments made by manufacturers of wood containers and wood pallets.

Geographic reference: United States
Year: 2008 and 2009
Market size: $6.89 and 5.51 Billion respectively
Source: “Sector 31: Annual Survey of Manufactures: Value of Products Shipments: Value of Shipments for Product Classes: 2009 and 2008,” 2009 Annual Survey of Manufactures, December 3, 2010, available online here.
Original Source: U.S. Census Bureau, Department of Commerce

Educational Services

The educational services covered in today’s market size post are all those not part of the traditional school system—elementary schools, secondary schools, colleges and universities. Think instead of all the other training and educational services that people may need. This market includes all those teaching and training people who wish to learn a new language; learn how to drive; learn how to cut and style hair; learn how to fix cars, leaky pipes, and/or computers, and learn how to be a better nanny, manager, secretary, etc.

This market size is based on estimated annual revenues.

Geographic reference: United States
Year: 2009
Market size: $42.9 Million
Source: “Table 12.1. Educational Services (NAICS 61) – Estimated Revenue for Employer Firms: 2009,” 2009 Service Annual Survey, February 2011, available online here.
Original Source: U.S. Census Bureau

U.S. Postal Service

The U.S. Postal Service (USPS) employed 656,000 people in 2010 making it one of the largest single employers in the United States. It handles billions of pieces of mail annually and has been in service since before we were even a nation (1775). In fact, the constitution itself calls for the establishment and maintenance of a postal service. While the rise of electronic means of exchanging data has had an impact on the USPS by reducing the number of items it is charged with carrying annually, the USPS continues to provide an important function in our society. Do not be fooled, no for-profit entity would charge the same amount for daily mail pick-up and delivery to those in distant and hard to reach rural areas as it would charge residents of a densely packed city.

It is true that the USPS is operating at a bit of a loss these days but that could be remedied with a few cent increase in the price of a stamp. While the USPS has been downsizing to adjust to the new realities of the Internet age it is also true that from November 1981 to 2010 the price of a standard stamp increased by less than the cost of inflation. The United States has one of the least expensive postal services anywhere. If you’re interested in how the USPS compares with postal rates in other countries, there is a nice chart on that subject available here.

Geographic reference: United States
Year: 1960 and 2010
Market size: Pieces of Mail Handled: 63.7 and 170.6 Billion respectively
Market size: Number of Post Offices: 35,238 and 27,077 respectively
Source: Pieces of Mail Handled, Number of Post Offices, Income, and Expenses, 1789 to 2010, available online here.
Original Source: United States Postal Service

Advertising

Advertising and Marketing Expenditures Worldwide

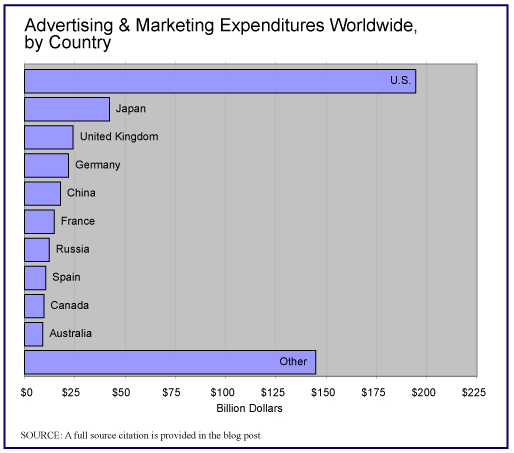
The United States is the undisputed leader worldwide when it comes to advertising, accounting for more than a third of all advertising and marketing expenditures worldwide. The chart shows the top ten countries by estimated advertising spending worldwide.

Please note that the graph is made from data that were produced in 2007 as a projection and much has changed since 2007. In fact, the summer of 2007 was a strange time, a time when investment firms were busy trying to pump confidence into a market that was weakening by the day. The report from which we got the figures used in the graph was published by Bear Stearns. In early 2008, Bear Stearns collapsed.

In a way, this example is a warning to all researchers to be careful when making assumptions about market data. By way of providing an interesting range of market sizes for Spending on Advertising and Marketing, we provide two measures for this overall market. One is from the Bear Stearns’ report produced in 2007 with projections for 2009. The other source is Advertising Age and its estimates have the advantage of reporting on 2009 after the fact. The graph is based on the projected data since that report offered the country-by-country breakdown.

Geographic reference: United States
Year: 2009
Market size: Bear Stearns projection, $194 Billion
Market size: AdAge estimate, $125 Billion
Source: (1) Advertising & Marketing Services, Bear Stearns, July 2007, page 40. (2) Advertising Age, June 21, 2010, page 10.
Original Source: ZenithOptimedia and Ad Age DataCenter.
Posted on April 5, 2011

Home Movie Rentals

The ways in which people obtain the movies they wish to watch at home have multiplied and changed over time, altering this market greatly. In 2005 the video rental store still had a 74% share of this market but this share has declined in favor of companies that offer a mail-in form of service, like Netflix, as well as kiosk style retail outlets. By way of punctuating this transition, in late summer 2010, Blockbuster, one of the largest video rental store chains still operating, filed for bankruptcy.

The market size listed here includes the following categories of video rental outlet: Subscriptions, Kiosks, Traditional Video-on-Demand (VOD), Video Stores, and Internet VOD.

Geographic reference: Unitd States
Year: 2010
Market size: $7.8 Billion
Source: USA TODAY, September 23, 2010, page 2B.
Original Source: Screen Digest

“Other” Renewables

In yesterday’s market size post we looked at non hydro-power renewable sources of electricity. These renewables are usually broken into four categories, Wind, Geothermal, Solar and Other. So, what does this “other” include? This category covers a wide range of methods for generating electricity and what follows is only a partial list of them: waste incineration, wood burning, connecting exercise bicycles in gyms to capture the kinetic energy they generate during spinning classes, and the harnessing of elephants and/or oxen to a grinding wheel used to turn a series of interlocking turbines. While each of these methods represent but a small fraction of all electric production, together they accounted for 6.8% of renewable electricity generation in 2007.

For a thorough discussion of these many methods of generating electricity, and statistics for their prevelance in the United States, the LaMarotte blog has a wonderful post on the topic, available here.

Geographic reference: World
Year: 2007
Market size: 235 Billion Kilowatt hours
Source: “Table 12. OECD and Non-OECD net renewable electricity generation by energy source, 2007-2035,” International Energy Outlook 2010, report available online here.
Original Source: U.S. Energy Information Administration (EIA)
Happy April Fools Day!

Electricity from Renewables

Renewable Energy Sources Worldwide

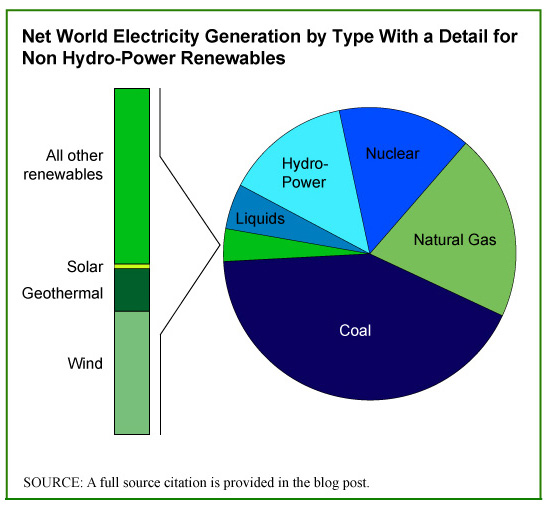
Hydroelectric power plants are the largest producers of electricity from renewable sources. As we saw in yesterday’s Market Size post, they represented 15.97% of world electricity production in 2008. That same year, electricity produced by all other renewable sources accounted for 2.4% of electricity generated. While responsible for only a small percentage of all electricity generation now, renewable sources are forecast to grow steadily through 2035 at which point the non hydro-power portion will account for 7.26% of global production.

The pie chart shows how electricity is generated worldwide and provides a detail of the small pie slice that represents non hydro-power renewables. The renewable energy source that is forecast to grow most quickly in the next decade is solar.

Please note that the Energy Information Administration (EIA) projections exclude electricity generated by so called off-grid sources, thus renewable energy consumed at the site of production. Energy producted by solar panels installed, for example, on a private home for the sole and exclusive use of the residents of that home is not counted in the EIA projections. If, however, those solar panels are tied into the public electric grid, then the electricity they generate is accounted for in the EIA projections. Time will tell how significant these off-grid electricity generation resources become.

Geographic reference: World
Year: 2007 and 2035
Market size: 463 and 2,554 Billion Kilowatt hours respectively (please note this is the size of electicity generation from non hydro-power renewable sources)
Source: “Table 12. OECD and Non-OECD net renewable electricity generation by energy source, 2007-2035,” International Energy Outlook 2010, report available online here.
Original Source: U.S. Energy Information Administration (EIA)

Hydroelectric Power

The production of electricity with hydroelectric power plants represents 80% of all renewable electric power generation worldwide. Hydro plants work by using the flow of water to turn a turbine, which then turns a metal shaft in an electric generator, which is the motor that produces electricity. Hydroelectric Power Plants accounted for 15.97% of all electric power produced worldwide in 2008.

In the United States, 6% of electricity is generated in hydro plants, a relatively small percentage compared with other nations. The ability to use hydroelectric power plants to generate electricity is, of course, to a large extent a matter of having the resources needed to harness water’s power. Paraguay, for example, produces 100% of its electricity—as well as electricity enough to export—from hydroelectric power plants while Saudi Arabia has no hydroelectric power generation. A chart which shows the top twenty countries in the world based on their production of hydro-power and based on the same source material is presented on the blog, LaMarotte, here.

Geographic reference: World
Year: 2008
Market size: 2,998 Billion Kilowatt hours
Source: “Table 1387. Net Electricity Generation by Type and Country: 2008,” Statistical Abstract of the United States: 2011, page 867, available online here.
Original Source: U.S. Energy Information Administration (EIA)

Nuclear Power Plants

Energy Pie Chart

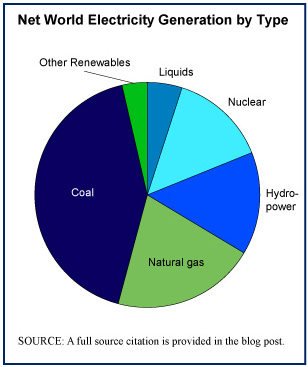
Electricity is generated in a variety of ways which are broken down into the six categories presented in the pie chart to the right. Each method of generating electricity has its pros and cons, its costs, risks, benefits, and advantage, all of which are much debated as we grapple with how best to produce electricity for a world whose demand for it grows annually. And growth in consumption is likely to speed up with the transition from the internal combustion engine to electric-powered vehicles (no pun intended).

Nuclear power plants accounted for 13.8% of global electricity generation in 2008. Nations who use nuclear power generation for the largest percentages of their electricity needs include France (78%), Belgium (55.8%), and Ukraine (47.1%). To see a nice chart of the top twenty leading nuclear power dependent nations, visit the LaMarotte blog, here.

Worth noting is the fact that Japan is among the twenty nations who depend most on nuclear power to generate its electricity. It comes in 10th on that list with 23.7% of its electricity generated at nuclear power plants in 2008.

Geographic reference: World
Year: 2008
Market size: 2,590 Billion Kilowatt hours
Source: “Table 1387. Net Electricity Generation by Type and Country: 2008,” Statistical Abstract of the United States: 2011, page 867, available online here. The data used to make the pie chart are for 2008 and come from the EIA’s International Energy Outlook 2010, available online here.
Original Source: U.S. Energy Information Administration (EIA)