Snowmobiles

The United States and Canada are by far the two largest national markets for snowmobiles in the world. The United States
accounted for 44% of all snowmobile unit sales in 2010 while Canada, with 0.5% of the world population, accounted for 34% of all snowmobile unit sales.

Geographic reference: World
Year: 2010
Market size: 111,492 snowmobiles sold.
Source: “Snowmobile Statistics,” International Snowmobile Manufacturers Association, available online here.

Fish and Fishery Product Exports

Exports of fish and fishery products have grown quickly in the last decade, as has all production of fish and fishery products, whether through capture (fishing) or aquaculture (cultivation). Leading fish and fishery product exporters in the world are, in order, China, Norway, Thailand, Denmark, Vietnam, and the United States. Together, the exports of these six countries in 2008 accounted for 36.5% of all exports.

Geographic reference: World
Year: 1998 and 2008
Market size: $51.45 and $101.98 Billion respectively.
Source: “Table 11 — Top Ten Exporters and Importers of Fish and Fishery Products,” page 52, The State of Fisheries & Aquaculture 2010, available online here.
Original Source: United Nations, Food & Agriculture Organization (FAO), Fisheries and Aquaculture Department.
Fish and Fishery Product Imports

Aquaculture is a fast growing part of the fish and fishery products market and as catches and harvests of these aquatic produce have increased over the last decade, so has the international trade of fish and fishery products. The top countries in terms of fish and fishery product imports are, in order, Japan, United States, Spain, France, Italy and China. Interestingly, China and the United States are also among the leading exporters of aquatic produce.

Geographic reference: World
Year: 1998 and 2008
Market size: $55.05 and $107.13 Billion respectively.
Source: “Table 11 — Top Ten Exporters and Importers of Fish and Fishery Products,” page 52, The State of Fisheries & Aquaculture 2010, available online here.
Original Source: United Nations, Food & Agriculture Organization (FAO), Fisheries and
Aquaculture Department.

Catholic Population

For this Ash Wednesday market size post, we looked up the size of the worldwide Catholic population, presented below. According to the source, half of all Catholics (49.4%) live in the Americas, a region of the world that contains about 14% of total world population.

Geographic reference: World
Year: 2009
Market size: 1.181 Billion.
Source: “World Catholic population growing; mixed results on priestly, religious vocations,” CatholicCulture.org, February 21, 2011, available online here.
Original Source: Annuario Pontifico, 2011 edition, The Vatican.

Aquaculture

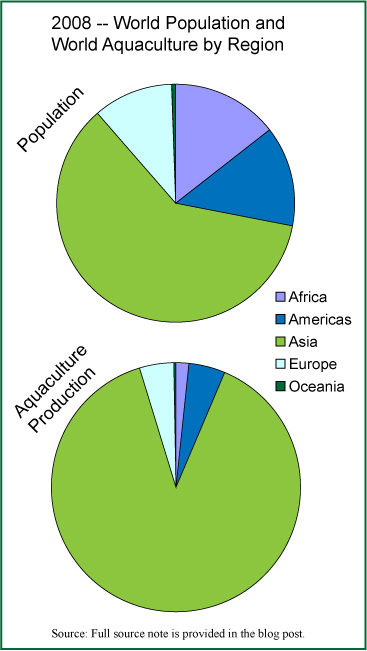
World Populaton and Aquaculture Production in 2008

Aquaculture is the cultivation of aquatic plants and animals for human use and is also referred to as aquafarming. To say that aquaculture has grown rapidly since 1970 would miss the point entirely. The quantity of aquatic produce harvested in 1970 was a mere fraction—1/20th—of that harvested in 2008. The growth of aquaculture has been strong across all regions of the world. Nonetheless, Asia has seen enough growth in aquacultural production to raise its already high percentage of world production in 1970 (69.6%) to a remarkable 88.8% in 2008. In the chart we provide here you will see the world’s population presented by region as well as the world’s aquacultural production by region.

The market sizes presented here do not include aquatic plants but do cover all caught and raised fish of any kind from marine and inland waterway sources.

Geographic reference: World
Year: 1980, 2000 and 2008
Market size: 4.7; 32.4 and 52.5 Million tons respectively.
Source: “Table 4 — Aquaculture Production by Region: Quantity and Percentage of World Production,” page 20, The State of Fisheries & Aquaculture 2010, available online here. The population data used in the chart are from the Statistical Abstract of the United States 2011, available online here.
Original Source: United Nations, Food & Agriculture Organization (FAO), Fisheries and
Aquaculture Department and U.S. Census Bureau.
Posted on March 8, 2011

Fishing and Aquaculture

As the world population grows, so do all efforts to feed that population. An important resource in this effort are our inland waterways, oceans and seas. Aquaculture—the cultivation of aquatic plants and animals also referred to as aquafarming—is the fastest growing sector within this industry. Fishing in the wild is, in many places, becoming more difficult because of either regulations to prevent overfishing or because overfishing itself has already caused a serious decline in the fish population, as happened to dramatic effect off the eastern coast of Canada in the early 1990s.

Tomorrow we’ll look at the aquaculture portion of this market.

The market sizes presented here do not include aquatic plants but do cover all caught and raised fish of any kind from marine and inland waterway sources.

Geographic reference: World
Year: 1998 and 2008
Market size: 117.2 and 142.3 Million tons respectively. Approximately 80% of both year’s totals were for human consumption—93.3 and 115.1 Million tons respectively.
Source: “Table — 1 World Fisheries and Aquaculture Production and Utilization,” page 3, The State of Fisheries & Aquaculture 2010, available online here. The data for 1998 are from the 2000 edition of this same report, same table number, page 6, and available online here.
Original Source: United Nations, Food & Agriculture Organization (FAO), Fisheries and Aquaculture Department.

Maine Lobster

Maine lobstermen have been increasing their fishing take for years now, reaching a new record in 2010. However, as with all commodities, there is a fine balance to be found between increasing volumes and price. The high prices per pound earned during the 2003 through 2007 period came down sharply in 2008 and 2009 when the price per pound hit a decade low of $2.93. In 2010 that price rose again, to $3.31, bringing it back to the level seen in 2000.

Geographic reference: State of Maine
Year: 2000 and 2010 (preliminary data)
Market size: 57.22 Million pounds valued at $187.7 Million and 93.36 Million pounds valued at $308.7 Million respectively.
Source: “Historical Maine Lobster Landings,” a report available online here.
Original Source: Maine Department of Marine Resources.

Movie Tickets

Some people wonder why so many Hollywood movies seem to be written to appeal to a very youthful crowd. As it turns out, this has to do with the fact that young people, aged 12 to 24 years, purchase a disproportionately high percentage of all movie tickets, disproportionate as compared to their representation within the population. In North America, young people aged 12 to 24 years represents 18% of the population but in 2010 bought 32% of movie tickets.

Geographic reference: North America
Year: 2010
Market size: 1.34 Billion movie tickets.
Source: Barnes, Brooks and Michael Cieply, “Graying Audience Returns to Movies, in Glasses That Aren’t 3-D,” The New York Times, page 1, February 26, 2011, New York, New York.
Original Source: Motion Picture Association of America

Historically Black Colleges & Universities

Historically Black Colleges and Universities (HBCUs) account for only 20% of African-American college students and yet 40% of engineering degrees earned by African-Americans are earned at HBCUs. “Similarly, of the 21 undergraduate producers of African American science PhDs, 17 were HBCUs.”

Geographic reference: United States
Year: 2010
Market size: 105 HBCUs serving over 300,000 undergraduates and graduate students.
Source: Muhammad, Jesse, “Despite Critics, HBCUs Still Relevant,” The Charlotte Post, February 19, 2011, St. Thomas, Virgin Islands.
Original Source: U.S. Commission on Civil Rights report “The Educational Effectiveness of Historically Black Colleges and Universities.” The Department of Education provides a list of HBCUs here.

Coffee in Puerto Rico

Puerto Rico is experiencing a decline in its coffee production. Over the period from 2002 to 2009 the island saw a decline of more than half in the number of farms growing coffee beans, from 9,000 in 2002 to 4,000 on 2009. According to the source article, the reasons for this decline are varied and include flooding from recent tropical storms as well as difficulty finding enough workers to pick the coffee beans at harvest time. Despite high unemployment rates an estimated $25 million worth of coffee was left unpicked in the 2009-2010 season, according to the Puerto Rico Coffee Buyers & Growers Association.

Geographic reference: Puerto Rico
Year: 2006 and 2010
Market size: 178,000 pounds and 80,000 pounds respectively. The harvest in 2010 had an estimated value of $23 million.
Source: “Sharp Drop in Coffee Production on Puerto Rico Worries Growers,” The Avis, February 19, 2011, St. Croix, Virgin Islands.
Original Source: Puerto Rico Coffee Buyers & Growers Association.