Yogurt Production

The dairy industry is broken into several product categories. Of these, yogurt is the one that has seen the greatest growth over the last decades. Between 1990 and 2009, the production of yogurt in the United States rose 291.4%. By way of comparison, the U.S. population grew by 24% in this same time period. While production of all dairy products grew, yogurt was by far the leading category. Butter production grew by 20.8% and the production of all cheeses grew 66.78% while the quantity of yogurt almost trebled during this two decade period.

Geographic reference: United States
Year: 1990 and 2009
Market size: 978.9 Million and 3.832 Billion pounds respectively.
Source: “Dairy Products, 2009 Summary,” USDA publication, April 2010, page 9, available online here. Data for 1990 are from the 1991 edition of the USDA report.
Original Source: U.S. Department of Agriculture, National Agricultural Statistics Service
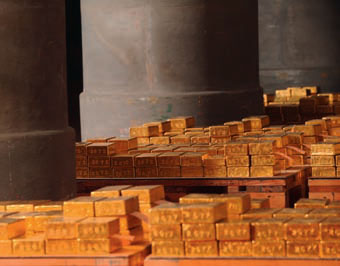
Gold Bars

A National Geographic journalist, while on assignment for the journal, was given a tour of the vast Paris underground, a maze of structures excavated over the years at various levels under the surface of the Earth. Gold Bars It consists of old crypts, used and unused sewer lines, metro train tunnels, the empty quarries from which much of the stone used to build the city was extracted, and heavily fortified vaults under banks and museums. The journalist and author of the source article, Neil Shae, and his colleague, photographer, Stephen Alvarez, were taken into the vault under the Banque de France and shown the French national gold reserves which are kept there in piles and piles of gold bars, each valued at around $500,000.

Geographic reference: France
Year: 2010
Market size: Approximately 2,600 tons.
Based on the price of gold on the international market on January 28, 2011, the approximate value of the gold bars under the Banque de France is $120.1 Billion.
Source: “Under Paris,” National Geographic, page 124, February 2011. The image of gold bars we use here comes from a Banque de France Annual Report, available online here.
Original Source: Banque de France

Buttermilk

The United States produces and consumes a great deal of dairy food, buttermilk being one of the small product categories within this huge market. The market size presented below is the quantity of butter milk produced in the United States in 2009. It represents 3% of all milk products and a mere 0.6% of all dairy products.

Geographic reference: United States
Year: 2009
Market size: 125.3 million pounds.
Source: “Dairy Products, 2009 Summary,” USDA publication, April 2010, page 9, available online here.
Original Source: U.S. Department of Agriculture, National Agricultural Statistics Service

Coffee

In the Upper Midwest of the United States this time of year, our love of hot drinks is particularly noticable, as it is, no doubt, anywhere the temperatures drops below freezing and stay there a while. This made us think of the market for coffee. The market sizes presented here are world production figures for two years.

The production of this commodity is tracked in 60-kilogram bags of the beans. The price of coffee is tracked by the International Coffee Organization and has been rising streadily in recent years. Based on the monthly composite indicator price at which coffee is traded on the New York market the price rose 160% between December 2000 and December 2009. Over the same period, world inventories grew by 40%. And, since December 2009 the price has continued to rise, reaching 173.9 cents per pound in November 2010, the equivalent to 260% of the price per pound back in December 2000. Savor every sip!

We could do a simple calculation to get a rough approximation of the value of coffee produced in 2010, based on the information in our source report. If the November composite price for all types of coffee beans was $1.74, then a 60-kilogram bag would cost about $47.33 and thus world production in 2010 was worth approximately $5.6 Billion. Of course, this is a very crude approximation so take it for what it is worth.

Geographic reference: World
Year: 2008 and 2010
Market size: 133.6 Million and 139 Million 60-Kilogram bags respectively.
Source: “Coffee: World Markets and Trade,” USDA Circular Series, Table 6 and Table 8, December 2010, available online here.
Original Source: U.S. Department of Agriculture, Foreign Agricultural Service, and the International Coffee Organization.

Bricks

Today we look at the market size of another construction materials industry that has been hard hit by the housing crisis in the United States. The market size being presented here, for two different years, is the number of standard brick equivalents or SBEs shipped by the industry per year. It is worth noting that the interim years, between 1995 and 2009, saw strong sales and shipments—in the range of 8 to 9 billion SBEs—but did not skyrocket quite as much as some other construction material sectors.

Geographic reference: United States
Year: 1995 and 2009
Market size: 7.0 billion and 3.7 billion SBEs respectively.
Source: “Boral USA, Analyst Visit,” a presenation, table 60, September 2009.
Original Source: Boral Ltd. and Brick Industry Association

Drug Company R&D

The market size presented here is an estimate of the dollars spent by the pharmaceutical industry on research and developement in 2009. This is a thorny and complex subject—what costs are included in R&D and how do pharmaceutical companies decide what to spend on developing new drugs and to modify old ones. For anyone interested in the subject beyond this quick snap shot, we recommend a report titled “Research and Development in the Pharmaceutical Industry,” published in 2006 by the Congressional Budget Office, and available online here.

Geographic reference: World
Year: 2009
Market size: $45.8 Billion
Source: “New Federal Research Center Will Help Develop Medicines,” The New York Times, Page 1, January 23, 2011
Original Source: Industry estimate

Industrial Scrubbers

The sorts of scrubbers we’re looking at here are a diverse assortment of complex pollution control devices. They are used to control—reduce and capture— pollutants that are emitted during an industrial process. The market size presented here is based on an industry projection.

Geographic reference: World
Year: 2012
Market size: $6.5 Billion
Source: Water World, October 2009
Original Source: McIlvaine Company

Military Spending

Spending on the military varies greatly from country to country and because, in part, of concerns about national security, acquiring information about just what is spent in each country is very difficult. The Stockholm International Peace Research Institute studies this topic and tracks it, publishing an international yearbook with statistics on the same. It has done this since 1969, making the 2010 edition of its yearbook the 41st edition.

The United States ranks at the top of the list of military spending by nation, as it has for decades. In 2009 the United States’ military spending represented 43% of world military spending. The United States’ share of world military spending has consistently been above 40% since the SIPRI Yearbook has been published.

Geographic reference: World
Year: 2009
Market size: $1.531 Trillion
Source: “The Top 10 Military Spenders, 2009,” SIPRI Yearbook 2010, Armaments, Disarmament and International Security, Page 11, available online here.
Original Source: Stockholm International Peace Research Institute

Diagnostic Testing Laboratories

The market for all things medical appears to be on a steady rise in the United States and the services of diagnostic testing laboratories no exception. According to the source article, one of the hot trends in this industry is genetic-testing which is done by scanning the DNA of a “consumer” in order to check for any signs of irregularity that may be a pointer to potential and specific diseases or health conditions to which the consumer may be at higher risk than the general public. The government has begun to look at this industry more closely, as these tests can offer results that are contradictory or misleading.

Based on our earlier market size posts on the diagnostic laboratory industry, we assume that this market size includes both medical testing laboratories as well as diagnostic imaging services, which are listed in detail here.

Geographic reference: United States
Year: 2009
Market size: $60 Billion
Source: Wall Street Journal, page B1, July 23, 2010
Original Source: Washington G-2 Reports

Dialysis Market

This market size represents the number of tax dollars spent to care for those on dialysis every year in the United States. In October 1972, Congress made revisions to the Social Security Act so that anyone diagnosed with kidney failure, regardless of age or income, would have comprehensive coverage under Medicare.

Initially, before guaranteed payments from Medicare, hospitals provided most of the care on a nonprofit basis, albeit on a limited basis. In 2010, 80 percent of the clinics offering dialysis were for-profit, with two-thirds of those operated by two chains: DaVita Incorporated (based in Colorado) and Fresenius Medical Care North America (a subsidiary of a German company that makes dialysis machines and supplies). Together these two companies make $2 billion in operating profits per year. More than 100,000 people start dialysis each year in the United States. In 2010, there were nearly 400,000 patients receiving dialysis.

Geographic reference: United States
Year: 2010
Market size: $20 billion
Source: Robin Fields, “God Help You. You’re On Dialysis,” The Atlantic, December 2010, pp. 82-92 and available online here.