Bikes in Europe

EuroBikes

Bicycles outnumber automobiles in the world and always have. While bike commuting dominates in most of the developing world, it lags far behind in the industrialized centers of the world. But, this is changing, slowly. The industrial world is experiencing a rise in bicycle ridership—in Europe motivated in part by the severity of the recession and financial crisis that started in 2008—and spending on infrastructure supportive of bike commuting is on the rise.

The graph shows the number of bicycles and number of passenger cars sold annually in the 27 countries of the European Community between 2001 and 2012. While the sale of cars has fallen, the sale of bikes has been reasonably steady—despite a very serious recession—and ended the period higher than it began, with sales of 19.7 million units in 2012 versus 18.9 million in 2001.

Geographic reference: European Community
Year: 2012
Market size: 19.72 million bicycles (850,000 of these bikes were electric-assist bicycles, the segment of the market growing most quickly)
Sources: (1) European Bicycle Market, 2013 edition, Industry & Market Profile, October 2013, Association of the European Two-Wheeler Parts’ & Accessories’ Industry, page 18, available online here. (2) Martin Campestrini and Peter Mock, European Vehicle Market Satatistics, Pocketbooks, 2011 Edition, ICCT, pages 39-48.
Original Source: COLIBI, the Association of the European Bicycle Industry, COLIPED, the Association of the European Two-Wheeler Parts’ & Accessories’ Industry and the International Council on Clean Transportation (ICCT)
Posted on November 6, 2013

Pharmacy Benefit Managers

The cost of prescription drugs in the United States is a subject about which there is much controversy. As the Affordable Care Act—or, Obamacare—gets off to a rocky start across the nation, we decided to look at just one small part of the prescription drug distribution network, about which most people are not particularly conscious. That is the segment made up of Pharmacy Benefit Managers (PBMs), middlemen who stand in a central position in the the prescription drug supply chain and who, it turns out, have carved out for themselves a rather lucrative business. The three largest PBMs—Express Scripts, CVS Caremark, and OptumRx—together control about 70% of all prescriptions filled in the United States.

PBMs are firms that provide an administrative service to insurance companies, large self-insured employers, and government benefit providers. They develop and maintain drug formularies—lists of specific drugs to be covered and the prices for each—for their insurance providing customers. They also negotiate with pharmaceutical companies for preferred pricing on the drugs covered in those formularies and they negotiate with retailers to accept those terms and participate in the PBM’s network of preferred pharmacies.

According to an article in Fortune magazine, “PBMs started as paper pushers: They began hand-processing medical claims in the 1970s and evolved into middlemen who touted their ability to use corporate customers’ combined purchasing power to negotiate huge discounts from pharmaceutical companies. Today the top PBMs are as big as or bigger than their clients.” The United States has a most unique health care delivery system, one which is significantly fuller of lucrative middleman-businesses than the systems present in other industrialized nations.

Today’s market size is the total estimated revenue earned by Pharmacy Benefit Managers in the United States in 2012.

Geographic reference: United States
Year: 2012
Market size: $250 billion
Source: Katherine Eban, “Painful Prescription,” Fortune, October 28, 2013, pages 202-207.
Original Source: J.P. Morgan analysts
Posted on November 4, 2013

Haunted Houses

Pumpkins-2013-4

Halloween is no longer a one day affair and haunted houses aren’t just for kids anymore. Many haunted houses are Hollywood-style productions with animatronics, realistic special effects, and actors in professional makeup. Haunted houses of the past were often run by neighborhood organizations as a way to do a bit of fundraising. Today, many are straight forward profit making operations.

Some operators of haunted houses combine them with rock concerts, mud runs, and paintball battles. Others combine multiple sets with corn mazes and hayrides. The haunted house experience has become an evening’s entertainment for many. More than 31 million people are expected to visit haunted houses in 2013. Worldwide there are around 2,500 haunted house attractions, the vast majority in the United States.

Today’s market size is the estimated total sales generated by haunted houses in 2013 (dare we say, by the haunted house industry?). Now that is scary….

Happy Halloween

Geographic reference: World
Year: 2013
Market size: $300 million… still a fraction of the estimated $7 billion that will be spent on Halloween related items and activities in the United States this year!
Source: Martha C. White, “It’s aliiiive! Haunted-House Industry Scares Up Big Money,” NBC News, October 6, 2013, available online here.
Original Source: National Retail Federation
Posted on October 31, 2013

Orange Juice

Faced with a greater variety of beverage choices, including exotic juices and energy drinks, and higher prices for orange juice due to the spread of citrus greening disease, consumers are increasingly choosing those alternatives over the breakfast staple, orange juice. Total U.S. retail unit sales in the 2012-2013 season reached its lowest level since the 1998-1999 season.

Data show the total U.S. retail sales of orange juice by volume in the 2012-2013 season.

Geographic reference: United States
Year: 2012-2013
Market size: 563.2 million gallons
Source: Alexandra Wexler, “The Slow Death of a Former Breakfast Table Star,” The Wall Street Journal, October 14, 2013, available online Original Source: Neilsen
Posted on October 29, 2013

Dentistry

Dentists

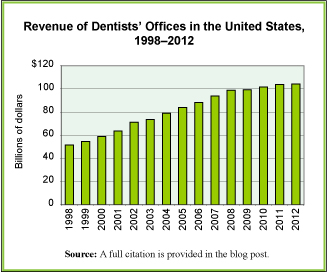
The practice of dentistry is a part of the overall health care industry and recent trends in this segment of the health care industry show a pattern similar to that of the industry as a whole. Steady growth. The graph shows estimated revenue taken in by Offices of Dentists annually from 1998 through 2012. While the rate of increase slowed a bit after the recession and financial crisis that hit in 2007 and 2008, growth in revenue continued. The growth in revenue for dentist offices between 1998 and 2012 exceeded inflation by 61.6% (dentistry 102.6% increase versus inflation which grew 41%).

Factors influencing that rate of growth for dentists are many of the same factors driving the overall health care industry, primarily among them, demographics and technology. As we age, we need more health care services of all sorts, including dental care. Technological advances are a driver in the field because they make available services that simply did not exists before and improve the ones that did. Already in the early 2000s the American Dental Trade Association was explaining that nearly half of dentists revenues were being generated from procedures and treatments that were not available 20 years earlier.

Today’s market size is the total estimated revenue earned by offices of dentists in the United States in 2000 and in 2012.

Geographic reference: United States
Year: 2000 and 2012
Market size: $58.8 billion and $104.3 billion respectively
Sources: “Table 8.1. Health Care and Social Assistance (NAICS 62)–Estimated Revenue for Employer Firms: 2002 Through 2010,” page 171, Service Annual Survey 2010, Issued in February 2012, U.S. Census Bureau, a link to which is offered here. Data for years before 2002 come from the Service Annual Survey 2003, available from the same web site. The data from 2011 and 2012 come from the “Estimated Quarterly Revenue for Employer Firms, Fourth Quarter 2003 Through Fourth Quarter 2012, part of the same Annual and Quarterly Services tracking done by the Census Bureau in preparing their annual report. The quarterly data are available here. Jeffrey R. Lavers, “Market Trends in Dentistry,” Dentistry iQ, available online here.
Original Source: U.S. Department of Commerce, Bureau of the Census
Posted on October 24, 2013

Public Pensions

Large pension plans have been struggling, in a period of very low interest rates since the financial crisis of 2008, to balance their asset allocation in such a way as to maximize returns. Assumptions have been made for many years now about what the average return on investments should be for public pension funds. The money going into these pension funds has been calculate accordingly. But, it turns out that the assumed annual rates of return (between 7% and 8%) have been quite optimistic. If the funds do not generate the anticipated annual returns, then more must be put into them if they are to meet their obligations to retirees. Over the ten year period 2002—2012, the public pension plans run by U.S. States have had an average annual rate of return of 6.4%.

Today’s market size is the value of all public pension assets in the United States in 2012.

Geographic reference: United States
Year: 2012
Market size: $2.6 trillion, approximately 16% of the total of all assets allocated for pensions, public and private, not including Social Security System funds
Sources: (1) Gretchen Morgenson, “How You Can Pay Millions and Lag Behind the Market,” The New York Times, B1, October 20, 2013. (2) Cliffwater 2013 Report on State Pension Performance and Trends, July 22, 2013, available here.
Original Source: Cliffwater and data filed by each state in what is known as the Comprehensive Annual Financial Report (CAFR)
Posted on October 21, 2013

Oil Drilling Rigs

OilRigs

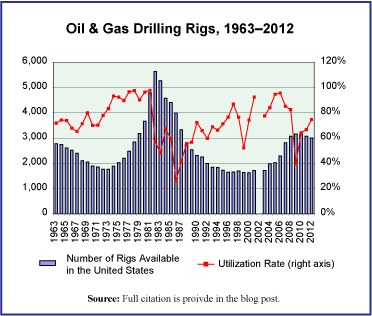
The rising demand for oil on the global scale has been an engine of growth for more than a decade now for the oil and gas drilling equipment industry. Since 2005, in the United States alone, newly constructed oil drilling rigs brought into the market numbered 1,538 valued at approximately $53 billion. We offer a graphic that shows the number of rigs available in the U.S. market annually and the percent of utilization of those rigs for a fifty year period.

Today’s market size is the number of oil drilling rigs available to the market in 2012, of which 94% are land based drills and 6% are drills for use in offshore applications.

Geographic reference: United States
Year: 2012
Market size: 3,006 oil drilling rigs
Source: “U.S. rig census historical data, 1955-2012,” National Oilwell VARCO Downhole’s 59th Annual Rig Census, page 10, November 2012, available online here.
Original Source: IHS Drilling Data, RigData, ODS-Petrodata, and WorldOil.com
Posted on October 16, 2013

Commercial Airline Baggage Fees

One of the ways in which airlines have found to raise revenue while remaining competitive in the electronic marketplace for airline flight tickets. While U.S. airline revenue from baggage fees went up at a rate of 17.23% per year from 2007 through 2012 overall operating income rose over the same period at a rate of 2.14% annually.

Today’s market size is the total amount charged by all U.S. commercial airlines, annually, for fees associated with the handling of baggage.

Geographic reference: United States
Year: 2007 and 2012
Market size: $464 million and $3.486 billion respectively
Source: Martha C. White, “Airlines Cash In on Every Inch, Even the Jammed Bins Overhead,” page 1, The New York Times, available online here.
Original Source: U.S. Department of Transportation, Bureau of Transportation Statistics
Posted on October 14, 2013

Cars in Europe

Car1

The auto market in Europe is far from recovering from the sharp decline in sales that occurred after 2007 and the financial crisis that hit in 2008. Industry forecasts suggest that it has yet to bottom out and many projections have the industry selling fewer cars in 2020 than it did in 2007. Meanwhile, in the United States this year, the auto market is expecting to reach 99.4% of the record sales reached in 2007, based on unit sales, and assuming the dysfunction in the nation’s capital does not derail the economy.

Today’s market size is the number of cars sold in the European Union—plus Iceland, Norway and Switzerland—in 2007 (peak year for sales), 2013 (based on mid-year projections), and 2020 (forecast).

Geographic reference: European Union, Iceland, Norway and Switzerland
Year: 2007, 2013, 2020
Market size: 16.0 million, 12.1 million, and 14.8 million respectively
Source: “Automakers, analysts disagree on when Europe’s sales will finally rebound,” Automotive News Europe, August 8, 2013, available online here. Vanessa Fuhrmans, “Europe’s Car Makers Spin Their Wheels, The Wall Street Journal, October 1, 2013, page A1.
Original Source: IHS Automotive
Posted on October 10, 2013

Digital Ad Spending

Measuring the world of advertising is tricky and when it comes to how much is spent on digital advertising, the task becomes harder yet. Part of the difficulty has to do with how one defines the market being measures, as is always the case when dealing with market sizes. But, in the case of an industry that is still forming and evolving, definitions are crucial. Clear definitions of what is being measured are not always provided by those reporting on these markets, or reporting on those reports. So use this market size data as a general guide to a market whose boundaries are a bit… fluid.

Today’s market size post is the size of the market for digital advertising based on two estimates of how much will be spend worldwide on digital advertising in 2013. The range presented is made up of the two estimates, sources for which are also provided. Worth noting is the fact that these estimates place spending on digital advertising at around one fifth of the spending on all advertising.

Geographic reference: World
Year: 2013
Market size: $95 to $117 billion
Source: John Bussey, “When Google Brainstorms, The Online World Shudders,” Wall Street Jornal, page B1, September 27, 2013. Michael Sebastian, “Ad Spending Forecast Revised Downward,” AdAge, August 14, 2013, available online here.
Original Source: eMarketer and GroupM
Posted on October 9, 2013