Refrigerators in Homes

This market size referred to in this post is the number of refrigerators that were in place, in residential housing units in the United States in 2009. While the source does not specify that this is the number of full sized and primary refrigerators per residence, it would seem that that must be the case, since we all know somebody with an old refrigerator (or two) in the basement…

Geographic reference: United States
Year: 2009
Market size: 126,534,000
Source: “Housing Units—Characteristics by Tenure and Region: 2009,”
Statistical Abstract of the United States: 2011, Table 983, page 616, U.S. Census Bureau, available online here.
Original Source: U.S. Department of Commerce, Bureau of the Census.

Residential Smoke Detectors

The number of working smoke detectors in residential housing units in the United States is listed below. This figure translates into a single smoke detector in 87% of all residential housing units in the country, which is an encouraging number. However, a more promising figure would be well over 100% since that would mean that many homes made use of more than a single smoke detector, as is recommended by the U.S. Fire Administration, part of the Federal Emergency Management Agency, on its web site here.

Geographic reference: United States
Year: 2009
Market size: 116,141,000 detectors
Source: “Housing Units—Characteristics by Tenure and Region: 2009,”
Statistical Abstract of the United States: 2011, Table 983, page 616, U.S. Census Bureau.
Original Source: U.S. Department of Commerce, Bureau of the Census.

Mortgage Debt Nationally

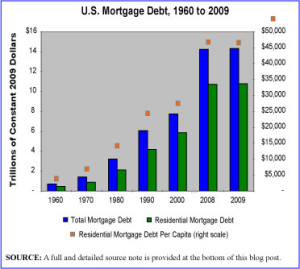
Mortgage Debt Nationally, 1960 to 2009

It should not come as a surprise to see that the U.S. has dramatically increased its national, total mortgage debt over the last few decades and in particular over the last decade. The graphic presented here shows the increase in national mortgage debt from 1960 to 2009. The most stiking leaps in indebtedness are seen in the period since 2000. While not surprising since we all now understand that the last decade was indelibly marked by a housing bubble, it is sobering to see just how high that debt really is, well after the bubble has burst.

The graphic depicts inflation adjusted dollars so what we see here is the increase in mortgage debt AFTER INFLATION. Just for fun, the graphic also shows—with an orange dot per year—residential mortgage debt on a per capita basis, using the right scale on the chart. We are certainly an indebted people.

Geographic reference: United States
Year: 2009
Market size: $14.3 Trillion, of which $10.8 Trillion is residential mortgage debt as opposed to commercial or agricultural mortgage debt.
Source: “Table 1191 — Mortgage Debt Outstanding by Type of Property Holder: 1952—2009,” Statistical Abstract of the United States: 2011, available online here.
Original Source: Board of Governors of the Federal Reserve System, “Federal Reserve Statistical Release, Z.1, Flow of Funds Accounts of the United States,” March 2010, available online here.
Full Source Note for Graphic: “Table 1191 — Mortgage Debt Outstanding by Type of Property Holder: 1952—2009,” Statistical Abstract of the United States: 2011; Population data 1960-1970: “No. HS-1. Population: 1900-2002,” available online here; Population data 1980-2009: “Table 7. Resident Population by Sex and Age: 1980 to 2009,” Statistical Abstract of the United States: 2011, page 11 available online here. The price deflator series used to convert current dollars to constant 2009 dollars came from two spreadsheets. For 1960: “Table 7.14. Chain-Type Quantity and Price Indexes for Gross Domestic Product by Sector,” Bureau of Economic Analysis, February 28, 2003 available online here.; For 1970-2009: “Table B-6. —Chain-type quantity indexes for gross domestic product, 1962-2010,” Economic Report of the President: 2011 Spreadsheet Tables, U.S. Government Printing Office, available online here.

Number of Repossessed Homes

During the housing market crisis we have read many and often contradictory accounts of just how many homes are in foreclosure, or the number of homes being foreclosed upon, or the number of home mortgages in a delinquent state. The process of foreclosing on a delinquent mortgage is a lengthy one and the measures being spoken of in the media so often refer to measurements at different stages in this process. What we present here are the number of homes that were repossessed by the bank, the number of home foreclosures that reach the endgame in three different years.

Geographic reference: United States
Year: 2008, 2009 and 2010 (estimate)
Market size: 862,000, 918,000 and 980,000 housing units respectively
Source: “Record U.S. Foreclosures in 2009,” an article on the World Socialist Web Site, available online here. The 2010 figure was taken from “Number of Homes Taken by Lenders Tumbles,” SFGate.com a news site sponsored by Hearst Communications Inc. and available online here.
NOTE: A new RealtyTrac Press Release came out on January 13, 2011 and has been reported on by the AP here. The AP report states that over one million homes were repossessed in 2010. This heavily repeated figure is all over the news, blogospher, and Internet yet, oddly, we have been unable to obtain an actual figure of repossessed homes from a thorough search of the RealtyTrac web site. So, we shall leave our originally presented estimate as is.
Original Source: RealtyTrac Inc.

Homes

After looking at the number of vacant homes in the United States, we turn to a measure of all houses in the
country. The market size number presented below includes all single-family attached and detached units as well
as apartments and condominiums, it is the total of all residential housing units.

This market size is broken out by type of housing unit in this way: Single family detached homes, 63.4%;
single family attached (townhouses and the like), 5.5%; apartments and condominiums in 2 to 4 unit buildings,
7.8%; units in 5 to 9 unit buildings, 4.9%; units in buidlings with 10 to 19 units, 7.4%; apartments and/or
condominiums in buidlings with 20 or more units, 7.4%, and manufactured/mobile homes, 6.8%.

Geographic reference: United States
Year: 2009
Market size: 130,112,000 housing units
Source: “Housing Units—Characteristics by Tenure and Region: 2009,”
Statistical Abstract of the United States: 2011, Table 983, page 616, U.S. Census Bureau.
Original Source: U.S. Department of Commerce, Bureau of the Census.

Vacant Houses

In this year’s edition of the always useful Statistical Abstract of the United States, a publication we turn to often in our work, we found the number of vacant housing units (single-family attached and detached units as well as apartments, all capable of occupancy year-round).

Geographic reference: United States
Year: 2009
Market size: 13,688,000 units
Source: “Housing Units—Characteristics by Tenure and Region: 2009,” Statistical Abstract of the United States: 2011, Table 983, page 616, U.S. Census Bureau.
Original Source: U.S. Department of Commerce, Bureau of the Census.

Mobile Phones Worldwide

The market size listed here is the number of mobile phones sold worldwide in the third quarter of 2010, of which, 19.3% were smartphones, as we saw in our last market size entry.

Geographic reference: World
Year: 3rd Quarter 2010
Market size: 417 Million Units
Source: “Gartner Says Worldwide Mobile Phone Sales Grew 35 Percent in Third Quarter 2010; Smartphone Sales Increased 96 Percent,” Gartner Newsroom press release dated November 10, 2010 and available online here.
Original Source: Gartner Inc.

Smartphones

The definition of a smartphone, according to PC Magazine, is as follows: “A cellular telephone with built-in applications and Internet access. Smartphones provide digital voice service as well as text messaging, e-mail, Web browsing, still and video cameras, MP3 player and video and TV viewing.” In addition to their built-in functions smartphones can run a variety of computer applications which makes them true computing devices. All of this functionality varies from smartphone to smartphone and to a large degree depends on the operating systems that run these devices. The leading smartphone operating systems, based on units currently in use, are (1) Apple’s iPhone OS, (2) RIM Blackberry OS, and (3) Google’s Android OS.

The market size listed here shows the number of smartphones sold worldwide in the third quarter of 2010. Smartphone sales in this quarter represented 19.3% of all mobile phone sales.

Geographic reference: World
Year: 3rd Quarter 2010
Market size: 80.5 Million Units
Source: “Gartner Says Worldwide Mobile Phone Sales Grew 35 Percent in Third Quarter 2010; Smartphone Sales Increased 96 Percent,” Gartner Newsroom press release dated November 10, 2010 and available online here.
Original Source: Gartner Inc.

Mobile Advertising Market

Mobile advertising is promotional activity designed to be delivered to cell phone, smartphone and other handheld device users. The market size presented here also includes Web-based search and display ads. As more consumers use smartphones and other handheld devices to access the Web, advertisers have devoted more money to mobile advertising. According to IDC, the mobile advertising market may double to $2 billion in 2011. Google had a 59 percent share of the market; Apple had less than a 10 percent share in 2010.

Geographic reference: United States
Year: 2009 and 2010
Market size: $368 million and $877 million, respectively
Source: Olga Kharif, “Google Gains Market Share in U.S. Mobile Ads,” Bloomberg Businessweek, December 3, 2010 and available online here.
Original Source: IDC

Internet Users Worldwide

The source for this market size is a poster offering a variety of interesting statistics about “our connected world.” Covered on the poster—a link to which is provided below—are statistics on the number of Internet users by country, broadband subscription rates by country, and numbers of people who have mobile only phone access by country. The data are presented graphically and we found it to be an interesting and useful presentation of the material.

Geographic reference: World
Year: 2010
Market size: 1.734 Billion Users, 20.8% of whom are in China.
Source: “Our Connected World,” made available online by buzzhunt.co.uk here.
Original Source: GigaOM, Cisco, and Internet World Stats.