Peanuts

The size of the market presented here is based on values at the wholesale level, farm receipts for sales of peanuts.

Geographic reference: United States
Year: 2009
Market size: $800 Million
Source: “U.S. Farm Sector Cash Receipts from Sales of Agricultural Commodities, 2006-2010F,” a table on the USDA’s Economic Research Service web site, available online here.
Original Source: Economic Research Service, United States Department of Agriculture
Corn

The size of the market presented here is based on values at the wholesale level, farm receipts for the sale of corn.

Geographic reference: United States
Year: 2009
Market size: $42.0 Billion
Source: “U.S. Farm Sector Cash Receipts from Sales of Agricultural Commodities, 2006-2010F,” a table on the USDA’s Economic Research Service web site, available online here.
Original Source: Economic Research Service, United States Department of Agriculture

Rice in the United States

The size of the market presented here is based on values at the wholesale level, farm receipts for sales of rice.

Geographic reference: United States
Year: 2009
Market size: $3.0 Billion
Source: “U.S. Farm Sector Cash Receipts from Sales of Agricultural Commodities, 2006-2010F,” a table on the USDA’s Economic Research Service web site, available online here.
Original Source: Economic Research Service, United States Department of Agriculture

Bridges

The total number of road bridges presented in this market size post can be broken down by whether these are rural bridges or urban area bridges. Rural bridges make up 74% of the total and urban bridges 26%. According to the source, nearly a quarter of these bridges are in poor shape, defined as either structurally deficient or, more ominously, functionally obsolete.

Geographic reference: United States
Year: 2009
Market size: 601,078 Bridges
Source: State Transportation Statistics 2009, “Table 1-5: Number of Road Bridges by Functional System: 2009,” Page A-5.
Original Source:Research and Innovation Technology Administration, Bureau of Transportation Statistics, U.S. Department of Transportation

Miles of Toll Roads

The vast majority of roads in the United States are freeways, in the true sense of the word, no direct fee for use is charged for traveling those roads. Only a very small number of toll roads exist in the United States, as of 2008. That number will likely grow if the trend towards the privitizing of previously public activities continues.

Geographic reference: United States
Year: 2008
Market size: 4,919.6 Miles
Source: State Transportation Statistics 2009, “Table 1-3: Toll Roads, Toll Bridges and Tunnels, and Toll Ferry Routes: 2008,” Page A-3.
Original Source:Research and Innovation Technology Administration, Bureau of Transportation Statistics, U.S. Department of Transportation

Roads in Texas

As a nation of heavy drivers, it is not surprising that we have an awful lot of paved roads. And in this nation of drivers, the largest state in terms of number of miles of paved roads is Texas. While Alaska is the state with the larger geographical area, it is sparcely populated compared to Texas, the state with the second largest number of square miles.

Geographic reference: Texas
Year: 2008
Market size: 306,404 Miles
Source: State Transportation Statistics 2009, “Table 1-1: Public Road Length, Miles by Functional Systems: 2008,” Page A-1.
Original Source: Research and Innovation Technology Administration, Bureau of Transportation Statistics, U.S. Department of Transportation

Paved Roads

Roads by Type

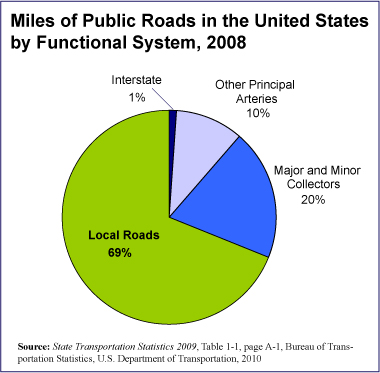
As a nation of heavy drivers, it is not surprising that we have an awful lot of paved roads. The market size presented here is for miles of paved, public roads in the United States. The chart shows how those roads are broken down by type: interstate freeways, other highways (arteries), smaller roads feeding the highway system (collector roads), and local roads.

Geographic reference: United States
Year: 2008
Market size: 4,042,778 Miles
Source: State Transportation Statistics 2009, “Table 1-1: Public Road Length, Miles by Functional Systems: 2008,” Page A-1.
Original Source: Research and Innovation Technology Administration, Bureau of Transportation Statistics, U.S. Department of Transportation

Vehicle Registrations

Here, we look at automobile registrations as well as light truck registrations. These vehicles are used for both personal and commerical purposes but can be seen as primarily vehicles for personal use.

Geographic reference: United States
Year: 2008
Market size: Automobiles, 137.1 Million and Light Trucks, 101.2 Million
Source: State Transportation Statistics 2009, “United States Fast Facts,” Page V.
Original Source: Research and Innovation Technology Administration, Bureau of Transportation Statistics, U.S. Department of Transportation

Motorcycle Travel

This past decade or so has seen increased number of passenger-miles traveled by motorcycle in the United States. Yet a closer look at the data shows that since the number of motorcycles registered rose at a faster rate (81%) than did the passenger-miles traveled (59%) between 2000 and 2008, each bike, on average, actually traveled slightly fewer miles in 2008 than it did in 2000. Motorcycle registrations in the United States numbered 4.3 million in 2000 and 7.8 million in 2008.

Geographic reference: United States
Year: 2000 and 2008
Market size: 11,516 and 18,395 Million Passenger-Miles respectively
Source: “Table 1-37: U.S. Passenger Miles (Millions),” Bureau of Transporation Statistics, National Transportation Statistics, available online here.

Rail Travel in the United States

Passanger-Miles on Rail

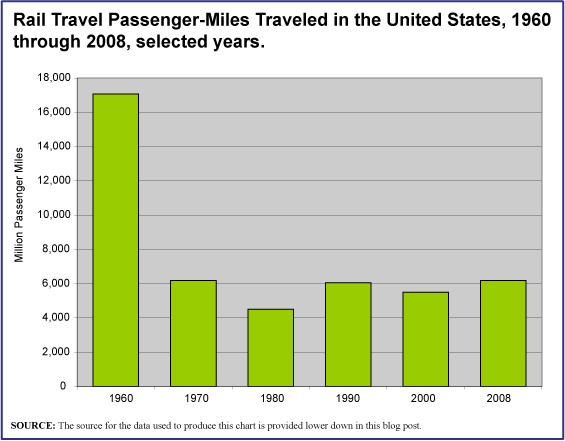
Today is another day of travel for millions of Americans as they head home after the Thanksgiving Holiday. So, here’s another market size related to travel, this time, travel by rail. Rail passenger-miles are presented here for intercity rail commuting. These data do not include commuter rail within a metropolitan area. This mode of transportation saw a sharp decline in the 1960s, a decline which had been in progress through the entirety of the 20th century. The chart shows passenger-miles traveled by rail each decade since 1960. This chart shows quite a different pattern than is seen when charting all other passenger travel modes tracked by the U.S. Bureau of Transportation Statisitcs. A few days ago, we charted air travel passenger-miles, by way of comparison.

Geographic reference: United States
Year: 2008
Market size: 6,179 Million Passenger-Miles
Source: “Table 1-37: U.S. Passenger Miles (Millions),” Bureau of Transporation Statistics, National Transportation Statistics, available online here.