Medical Laboratories

As is true with all the sectors of the health care industry, medical laboratories have seen significant growth over the last decade plus with revenues more than doubling between 1997 and 2007.

The Bureau of the Census definition for “medical laboratories” reads as follows: “This U.S. industry comprises establishments known as medical laboratories primarily engaged in providing analytic or diagnostic services, including body fluid analysis, generally to the medical profession or to the patient on referral from a health practitioner.”

Geographic reference: United States
Year: 1997 and 2007
Market size: $10.4 Billion and $24.3 Billion in annual receipts respectively
Source: “2007 Economic Census: Sector 62: Health Care and Social Assistance Programs: Preliminary Comparative Statistics for the United States 2007 and 2002”, March 26, 2010, [Online] here. Data for 1997 are from a report by the same title in the “1997 Economic Census” series.
Original Source: U.S. Bureau of the Census
Diagnostic Imaging Services

The increased use of electronic machinery for medical diagnosing has given us greatly increased and more accurate diagnostic tools, tools which can often be used instead of more invasive surgical intervention. Diagnostic imaging centers are at the center of the medical services industry. Revenues earned by diagnostic imaging centers grew by 200% between 1997 and 2007, an annual growth rate of 18.1%. By way of comparison, the inflation rate over this period averaged 2.6% annually.

The activities which fall under the umbrella term “diagnostic imaging” include four major types of scans: 1. Radiological (x-rays); 2. Computer Tomography (CT); 3. Magnetic Resonance Imaging (MRI), and 4. Ultrasound. Worth noting is the fact that the term also refers to the activities undertaken by physicians, now and throughout history, when they used their tactile sense, feeling an area of the body in order to visualize the condition of internal organs. The services offered at diagnostic imaging centers do not include this most basic form of diagnostic imaging.

Geographic reference: United States
Year: 1997 and 2007
Market size: $5.87 Billion and $17.58 Billion in annual receipts respectively
Source: “2007 Economic Census: Sector 62: Health Care and Social Assistance Programs: Preliminary Comparative Statistics for the United States 2007 and 2002”, March 26, 2010, [Online] here. Data for 1997 are from a report by the same title in the “1997 Economic Census” series.
Original Source: U.S. Bureau of the Census

Lighting Worldwide

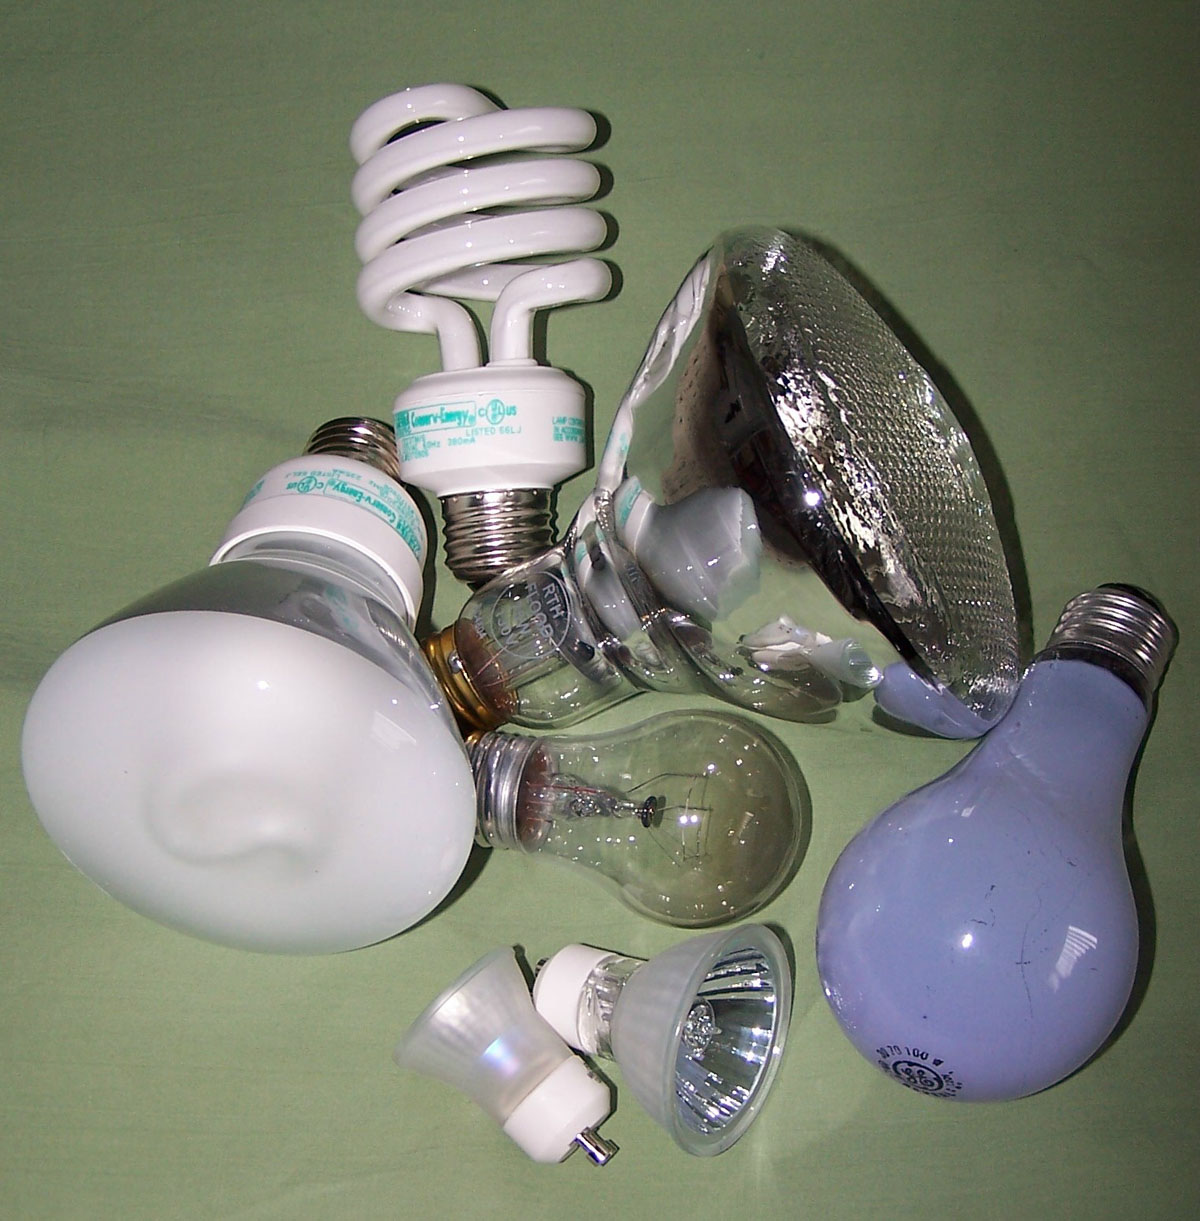
Lots of light bulbs
On the eve of the end of daylight savings for 2010 in the United States, we are headed into a darker period and one in which we’ll be switching on the lights earlier and earlier each day. So, today we look at the lighting market worldwide. According to a speech by the chairman of Philips Lighting North America, Kaj de Daas, there were approximately 4 billion screw-in light sockets in the United States in 2008. In terms of the global lighting market, Royal Philips, parent company of Philips Lighting North America, represents approximately 5% of the total.

Geographic reference: World
Year: 2008
Market size: $75 Billion
Source: “The Global Lighting Market, Courtesy of Philips,” October 23, 2008, Seeking Alpha, [Online] here.
Original Source: Philips Lighting North America

Home Health Care Market

Yesterday’s post looked at the growth of receipts at hospitals in the United States between 1997 and 2007. Their receipts grew at a healthy clip of 10% a year over this period. The market for home health care services saw even greater growth over this period. Revenues generated by home health care service providers grew at an average rate of 33% per year between 1997 and 2007. There were 3,375 establishiments primarily engaged in providing home health care services in the United States in 1997 and in 2007 there were 22,975 such establishiments.

The Bureau of the Census definition for the “home health care services” industry reads as follows: “This industry group comprises establishments primarily engaged in providing skilled nursing services in the home, along with a range of the following: personal care services; homemaker and companion services; physical therapy; medical social services; medications; medical equipment and supplies; counseling; 24-hour home care; occupation and vocational therapy; dietary and nutritional services; speech therapy; audiology; and high-tech care, such as intravenous therapy.”

Geographic reference: United States
Year: 1997 and 2007
Market size: $10.1 Billion and $46.2 Billion in annual receipts respectively
Source: “2007 Economic Census: Sector 62: Health Care and Social Assistance Porgrams: Preliminary Comparitive Statistics for the United States 2007 and 2002”, March 26, 2010, [Online] here. Data for 1997 are from a report by the same title in the “1997 Economic Census” series.
Original Source: U.S. Bureau of the Census

Hospitals

People who follow these mattters at all know that expenditures on health care in the United States have been rising steadily and at a pace far higher than inflation for many years now. So, it comes as no surpise to see the size of the market for hospital services more than double in the period 1997 to 2007. Hospital revenues grew by 108.6% between 1997 and 2007 which is 80% above the rate of inflation over this period.

The Bureau of the Census definition of the industry covered by this market size, a subset of the overall health care industry, reads as follows: “Industries in the Hospitals subsector provide medical, diagnostic, and treatment services that include physician, nursing, and other health services to inpatients and the specialized accommodation services required by inpatients. Hospitals may also provide outpatient services as a secondary activity. Establishments in the Hospitals subsector provide inpatient health services, many of which can only be provided using the specialized facilities and equipment that form a significant and integral part of the production process.”

Geographic reference: United States
Year: 1997 and 2007
Market size: $339 Billion and $707 Billion in annual receipts respectively
Source: “2007 Economic Census: Sector 62: Health Care and Social Assistance Porgrams: Preliminary Comparitive Statistics for the United States 2007 and 2002”, March 26, 2010, [Online] here. Data for 1997 are from a report by the same title in the “1997 Economic Census” series.
Original Source: U.S. Bureau of the Census

Registered Voter Population

On election day we look back to the last national election day to measure the size of the voting population in the United States. Worth noting is the fact that 2010 is a congressional election year but not a presidential election year. Throughout our history, voter turnout is higher in presidential election years than in midterm election years.

Geographic reference: United States
Year: 2008
Market size: Number of voting age citizens: 206.1 Million
Market size: Number of registered voters: 146.3 Million
Market size: Number of people who actually voted: 131.1 Million or 63.7% of citizens of voting age and 89.7% of the registered voter population.
Source: “Voting and Registration in the Election of November 2008”, Current Population Reports, May 2010, [Online] here. This is a most interesting report, full of details about the voting age population in 2008, measured and assessed by a number of demographic aspects: age; educational attainment level; race; ethnicity; gender, etc.
Original Source: U.S. Bureau of the Census

Dentistry

After a holiday celebrated by the indulgence in candy, it seems only right to take a look at the market for dental services. Over the period 2002 to 2007 the number of establishments in the United States offering dental services grew by 7.5%, from 118,305 to 127,033. Employment in those offices grew at a faster rate, from 743,628 to 825,869, or 11%. So we had more offices that were on average slightly larger in 2007 than in 2002. The largest area of growth for these establishments was in their revenue, which grew 32.5% over this same period.

Geographic reference: United States
Year: 2002 and 2007
Market size: $71.1 Billion and $94.2 Billion respectively
Source: “2007 Economic Census: Sector 62: Health Care and Social Assistance Porgrams: Preliminary Comparitive Statistics for the United States 2007 and 2002”, March 26, 2010, [Online] here.
Original Source: U.S. Bureau of the Census

Halloween Market

The size of the market for all Halloween holiday spending is rather hard to measure as it incorporates many things, candy, snacks, costumes, pumpkins, scary decorations, etc. The results of a much-quoted survey undertaken by the National Retail Federation are what we present here. They represent an increase of 17% over estimated spending on Halloween in 2009. Shall we take this as a good sign, a sign of people feeling freer to spend money on non essentials?

Happy Halloween!

Happy Halloween

Geographic reference: United States
Year: 2010
Market size: $5.8 Billion
Source: “Halloween Spending Expected to Rise this Year,” October 11, 2010, Kansas City Star, [Online] here.
Original Source: National Retail Federation

Hydroelectric Power Market

Over the period 2002 to 2007, the cost of energy rose steadily, as did the revenues generated by those companies in the business of extracting (in the case of fossil fuels), processing, moving, storing, and selling energy. For that reason, it is surprising to see that hydroelectric power generation in the United States actually saw a decline in revenues, as well as employment over the period. In 2002 the hydroelectric power generation industry employed 6,360 people and in 2007 it employed only 3,795.

Geographic reference: United States
Year: 2002 and 2007
Market size: $2.73 Billion and $2.24 Billion respectively
Source: “2007 Economic Census: Sector 22: Utilities: Preliminary Comparitive Statistics for the United States 2007 and 2002”, July 31, 2009, [Online] here.
Original Source: U.S. Bureau of the Census

Number of Books in the World

Books as far as the eye can see

This, of course, is a somewhat unusual sort of market size item but it is an actual estimate produced by Google as part of its overall effort to try and digitize every book in existence. For details about how this count was done, what was included and what was not, check the link below to a blog post by a Google engineer involved in the project.

Geographic reference: World
Year: 2010, as of August 5th
Market size: 129,864,880 books
Source: “All the Books in the World,” LOCUS, September 2010, page 11.
Original source: Google. For details, here is a link to a blog post explaining the estimate.