Home Sales

Housing

The residential housing market in the United States is beginning to show signs of recovery five years after the market crashed. Whiles signs of recovery are there in the number of houses selling as well as the prices they are selling for, confidence in these signs appears to be weak and many in the real estate industry fear that a rise in interest rates could cause the housing market recovery to stall.

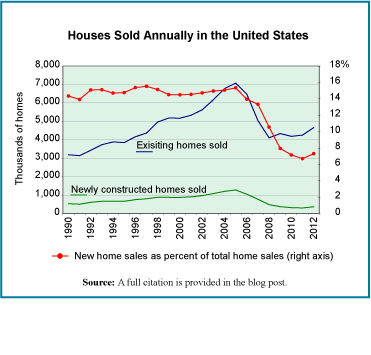
The graph shows home sales in the United States by number of new and existing homes sold annually. The percent of total sales made up by the sale of newly constructed homes is shown in red.

Today’s market size is the number and approximate value of newly constructed homes that were sold in 2005 (the peak year in terms of number of homes sold) and in 2012.

Geographic reference: United States
Year: 2005 and 2012
Market size: 1.283 million units for a value of $381.1 billion in 2005 and 364 thousand units in 2012 with a value of $107.5 billion
Source: “New Residentail Sales, Historical Data,” U.S. Census Bureau, last updated on August 12, 2013, available online here.
Original Source: U.S. Bureau of the Census and National Association of Realtors
Posted on September 30, 2013
Libraries

Anyone who is truly interested in knowledge will be a friend of the library. Even in an age which defines itself as the “information age,” libraries play an essential role in society. In fact, based on U.S. library usage data from this century, that role is growing.

Today’s market size is the estimated total number of libraries in the United States. The largest category of library is the school library, which accounts for slightly over 80% of all libraries and does not include the academic library which is associated with higher education. The second largest category of library is the public library with a 7.5% share of the total.

Geographic reference: United States
Year: 2010
Market size: 119,987
Source: “Number of Libraries in the United States — ALA Library Fact Sheet 1,” American Library Association, August 2013, available online here.
Original Source: The ALA web site provides a long list of sources upon which the organization drew in reach the total count
Posted on September 23, 2013

Global Feed Industry

The feed industry is a part of the agriculture sector. The term feed here is used as a noun and refers to the food provided to agricultural animals and fish, to livestock. Many different things are used as feed. These are usually broken into two categories, concentrates and roughage. The concentrates are the high energy value feeds that come from cereal grains, high-protein oil meals, and by-products from processing sugar-beets, sugarcane, animals and fish. The category of feed referred to as roughage includes pasture grasses, hay, silage, cornstalks and the like.

An area of interest and research in this industry is raising insects for use as animal feed. It has the potential for being a very sustainable, comparatively low energy way to significantly increase feed stocks over the next decades. This is important since United Nations’ estimates predict a 70% increase in demand for agricultural feed over current rates by the year 2050.

Today’s market size is the quantity and value of feed production globally in 2011.

Geographic reference: World
Year: 2011
Market size: 870 million tons valued at $350 billion
Source: “Insects as Animal Feed,” The Fish Site, June 3, 2013, available online here.
Original Source: United National Food and Agriculture Organization (FAO)
Posted on September 20, 2013

Non-Alcoholic Beer

The volume of non-alcoholic beer consumed worldwide is on the rise. According to The Economist (full citation below), the volume of non-alcoholic beer consumption globally was 80% higher in 2012 than it had been in 2007. Part of this rise is the result of increased consumption of this beverage in the Middle East. Increasing penalties for drunk driving in several European countries has also been seen by industry analysts as a contributor to the rise in demand for non-alcoholic beer.

Today’s market size is the volume of non-alcoholic beer sales globally in 2012.

Geographic reference: World
Year: 2012
Market size: 2.2 billion liters (by way of comparison, world consumption of beer annually is in the range of 148 billion liters)
Source: E.H. “Why are sales of non-alcoholic beer booming?” The Economist, August 11, 2013, available online here.
Posted on September 17, 2013

Newsprint

Newsprint

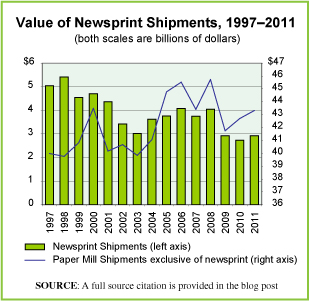
Newsprint is a grade of paper used primarily for printing newspapers, advertising inserts and advertising mailers. It comes not in sheets but in huge, long roles for use in web offset, letterpress and flexographic printers. As the digitizing of information has advanced, it will comes as no surpirse to see that the demand for newsprint has been on the decline. We made a graph to show how the value of newsprint shipments by the paper industry have faired over the last fifteen years in the United States. The newsprint industry is designated as NAICS 322122 by the U.S. Census Bureau.

Since the majority of newsprint is used in the production of newspapers, the decline of the newspaper industry is mirrored in the decline of newsprint production. Among the factors causing a decline in the newspaper industry are a declining readership, particularly that of young audults, the rise of digital editions for which paid subscriptions are far less, and the decline in advertising revenue that has resulted as advertisers’ budgets are being split between a growing number of media outlets, many online. For figures on the newspaper industry, check our earlier posts on that market, here.

Today’s market size is the value of U.S. newsprint shipments at the wholesale level in 1998 (a peak year for shipments) and 2011. Worth noting is the fact that declines in newsprint have exceeded declines in newspaper circulation figures during this period—46% decline for newsprint shipments versus 21% decline for daily newspaper circulation figures—suggesting that the papers that are in circulation are not only fewer than before, but have fewer pages as well.

Geographic reference: United States
Year: 1998 and 2011
Market size: $5.42 billion and $2.92 billion respectively
Source: “Value of Shipments for Product Classes,” Annual Survey of Manufactures, editions: 2001, 2005, 2008 and 2011. This series of reports is produced by the U.S. Bureau of the Census in all non Economic Census years. The reports are available online through the Census Bureau’s American Fact Finder system, here. Newspaper circulation data are from “Newspaper Circulation Volume,” Newspaper Association of America, September 4, 2012, available online here.
Original Source: First Research and the U.S. Bureau of the Census
Posted on September 12, 2013

U.S. Military Personnel

Today’s market size is one of those that we do from time to time that takes liberty with the term “market.” It is the number of people employed by the U.S. Department of Defense, as active duty personnel as well as civilian employees.

Geographic reference: United States
Year: U.S. Budgetary Fiscal Year 2013
Market size: 1,478,000 active duty and 791,000 civilians
Source: “Table 7-5 Department of Defense Manpower,” National Defense Budget Estimates for FY 2013, page 259-260, March 2012. This publication is often refered to as the “Greenbook.” It is available online here.
Original Source: Office of the Under Secretary of Defense, U.S. Department of Defense
Posted on September 11, 2013

Paper Consumption

While the use of paper and paper products has not declined significantly,—despite much talk in the 1990s of a coming paperless society—the publishing industry is using less paper. According to a new industry report, paper consumption by the book industry declined by 34% from 2006 to 2010, due in part to the great recession and in part to increasing sales of e-books. This information comes from a report whose primary purpose was to track the book publishing industry’s overall environmental impact on the world. Another item highlighted in the report is the increasing quantity of recycled material in the paper that is used by the industry. According to the report, the use of recycled fiber by the book publishing industry rose from 5% of all fiber in 2004 to 24% in 2010.

By way of placing this information in the context of the larger paper industry, it is worth noting that during the period covered in the Book Industry Environmental Trends report, the total value of product shipments made by U.S. Paper and Newsprint Mills dropped by 6.2%, from $45.5 billion in 2006 to $42.7 billion in 2010. In 2006, newsprint represented 7% of the value of all paper mill product shipments and by 2010 that percentage had fallen to 3.6% . But, a discussion of newsprint takes us into a complex niche within the paper market, one will cover in another post, one day soon.

Today’s market size is the volume of paper consumed by the U.S. book industry in 2006 and 2010.

Geographic reference: United States
Year: 2006 and 2010
Market size: 1.76 million tons and 1.16 million tons respectively
Source: Jim Milliot, “Keeping the Green in Publishing,” Publishers Weekly, July 22, 2013, pages 5-6, available online here. The rate of decline in value of output by U.S. Paper and Newsprint Mills was calculated from figures published by the U.S. Census Bureau in its Annual Survey of Manufacturers, (ASM) series of reports, “Value of Product Shipments,” and specifically, data reported under NAICS codes 322121 and 322122. The ASM data are available online here.
Original Source: Book Industry Environmental Trends and U.S. Census Bureau
Posted on September 10, 2013

Luxury Message Chairs

InadaMessageChair

The term “stress” is heard frequently these days and is often associated with a long list of both mental and physical ailments. There are also many industries that offer to sell stress relieving aids, from consumables like specially formulated juices and deep penetrating lotions to gym memberships and spa resort getaways. Message has long been a way to relax, to reduce stress. So the idea of a chair that will message your entire body whenever you want has a natural appeal for those looking for ways to relieve or reduce stress.

Today’s market size is the approximate value of the luxury message chair market in the United States in 2012, based on estimates from one of the industry’s leaders. This market size refers to fully automated message chairs and not chairs used by masseurs/masseuses, also called message chairs. Luxury message chairs are a high-end product often costing several thousand dollars. Nonetheless, the luxury message chair industry is a tiny part of the overall group of industries whose products and services are aimed at stress reduction.

Geographic reference: United States
Year: 2012
Market size: $250 million
Source: Bruce Horovitz, “All Stressed Out? Business will sell you some peace,” USA Today, August 5, 2013, available here. The photo is from the Inada web site here.
Original Source: Inada Message Chair
Posted on September 6, 2013

Insurance Industry

Insurance carriers and those involved with selling and managing insurance policies have seen a slow recovery since the recession. Over the period 2007 to 2012, industry revenue did not keep up with the rate of inflation, growing 4.2% over the period. In the earlier part of the decade, from 2002 to 2007, it grew 21%, exceeding inflation by 6%.

The industry presented here [NAICS 524] is defined by the U.S. Census Bureau as follows, “all establishments that are primarily engaged in one of the following: (1) underwriting (assuming the risk, assigning premiums, and so forth) annuities and insurance policies or (2) facilitating such underwriting by selling insurance policies, and by providing other insurance and employee-benefit related services.” Companies falling into the second part of the above definition account for slightly less than 10% of industry revenues.

Today’s market size is the size of the insurance industry in the United States based on its revenues in the years 2002, 2007 and 2012.

Geographic reference: United States
Year: 2002, 2007 and 2012
Market size: $1.38, $1.67 and $1.74 trillion dollars respectively
Source: “Table 9 – Finance and Insurance (NAICS 52) Estimated Quarterly Revenue for Employer Firms Third Quarter 2009 Through Fourth Quarter 2012,” from a series of reports made available by the U.S. Census Bureau at their web site, Annual & Quarterly Services, available here. The data for 2002 and 2007 are from “Finance and Insurance: Geographic Area Series: Comparative Statistics for the United States (2002 NAICS Basis): 2007 and 2002,” 2007 Economic Census, available here.
Original Source: U.S. Bureau of the Census
Posted on September 5, 2013

Apples and Cherries in Michigan

Farming is not for the weak of heart as volatility in agricultural output is still the norm. After a year of devastation for the fruit industry in the State of Michigan, this year is shaping up to be a strong recovery. No matter how much technological know-how we invest in our agricultural industries, in the end, weather can still have the final say on whether a year is a boon or a bust.

Michigan is the third largest apple producing state in the union and its state flower is the apple blossom. In 2012, unusual weather patterns in the early part of the season destroyed many of the fruit crops for the year. In 2013, the pent-up energy in the fruit bearing trees has combined with perfect weather conditions to produce what is expected to be a bumper crop for most fruits grown in Michigan.

Today’s market size is the quantity of apples and cherries grown in Michigan in 2012 and 2013, based on early 2013 crop reports.

Geographic reference: Michigan
Year: 2012 and 2013
Market size: Apples: 2.74 and 30.0 million bushels respectively
Market size: Cherries: 11 and 212 million pounds respectively
Source: Michael Martinez, “Michigan expects biggest apple crop in decades,” The Detroit News, August 31, 2013, available online here.
Original Source: Apple Committee and the Michigan Farm Bureau
Posted on September 3, 2013