Used Merchandise

UsedMerchStores

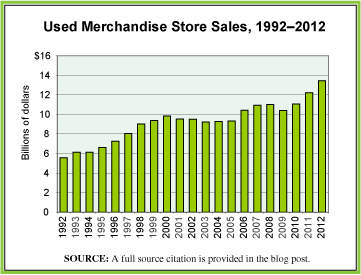
Whether it be the post-recession, budget-conscious consumers or eco-friendly consumers who’d rather reuse than buy new, more and more people are buying used merchandise. In a July 2013 survey by America’s Research Group, nearly 20% of adults surveyed said they shopped at a secondhand store in the past year. According to the Association of Resale Professionals, there are an estimated 25,000 used merchandise stores in the United States, which includes thrift, resale, and consignment shops. This number is projected to increase by 7% annually.

The graphic shows U.S. sales made through used merchandise stores from 1992 through 2012. What is worth noting is the fact that, as is true for all categories of products, used merchandise is sold online as well as through retail outlets. The sales figures presented in the graphic do not include online sales of used merchandise, think eBay… We suspect that if those sales were added to the sales made through retail outlets, the significance of a shift towards used would be even more striking.

Today’s market size is the sales volume of used merchandise stores in the United States 2002 and 2012.

Geographic reference: United States
Year: 2002 and 2012
Market size: $9.5 and $13.4 billion respectively
Source: Lindsay VanHulle, “As Recession Alters Shopper Attitudes, Secondhand Shops Thrive,” Lansing State Journal, August 25, 2013, pages 1E, 3E. The graphic was made with data from the U.S. Census Bureau’s series of reports on the retail trade sector, specifically: “Estimated Annual Sales of U.S. Retail and Food Services Firms by Kind of Business: 1992 Through 2011,” released March 29, 2013 and available here.
Original Source: First Research and the U.S. Bureau of the Census
Posted on August 28, 2013
Cold Cereal for Breakfast

In recent years makers of cold cereal have seen their revenues drop as more people choose a variety of other options for their first meal of the day. In the second quarter of 2013, Kelloggs reported a 3% drop in sales of cold cereal and General Mills reported a 7% drop. Yogurt, shakes, and on-the-go breakfast bars are popular alternatives to cold cereal. While cold cereal is still the number one choice for breakfast in the United States, yogurt is the second most popular choice with revenues of nearly $7 billion. And within the yogurt market, it is Greek yogurt that has pushed sales skyward for several years now. A novelty just five years ago, Greek yogurt has grown to represent 40% of the yogurt market since then.

Today’s market size is the value of sales of cold cereal in the United States for the year, August 2012 to August 2013.

Geographic reference: United States
Year: August 2012-2013
Market size: $9 billion
Source: Jane Wells, “Cereal Killers: Americans’ New Breakfast Habits,” CNBC, August 23, 2013, available online here.
Posted on August 27, 2013

Organic and Natural Juices

Just as more and more people are choosing to buy organic produce, so too are they looking for similar choices in the juice aisle of the supermarket or health food store. Data show organic and natural juice revenue for 2012, a 13% increase over 2011.

Geographic reference: United States
Year: 2012
Market size: $2.4 billion
Source: Clare O’Connor, “Hain Celestial is Juiced,” Forbes, August 12, 2013, pages 40-42.
Original Source: Nutrition Business Journal
Posted on August 21, 2013

Seaborne Freight

SeaborneFreight

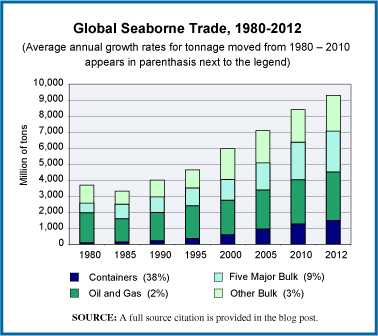
The most energy efficient means of moving freight is by moving it over water. The increase in global trade over the last few decades and particularly the increase in moving raw materials long distances as part of the overall manufacturing process, has meant a significant rise in seaborne freight. The chart we offer here shows that increase by charting the tonnage moved annually by sea, broken into three categories: (1) tonnage moved in shipping containers, (2) movements of oil and gas, and (3) movements of cargo in bulk which includes all those things which may be moved in a dry cargo container ship. This final category is further broken down into the five major bulk products and all other bulk. The five major bulk products are: iron ore, grain, coal, phosphates and bauxite.

The overall trajectory of growth is clear. What may not be quite as clear is the growth in how much of that freight is moved in container ships, the category shown in blue at the bottom of each bar. The growth of containerized freight movements has been the most striking. Over the period 1990 to 2012 the movement of containerized freight, when measured in tons moved, increased by 16% per year For those interested in more on container shipping, here’s a link to an earlier post we did covering the container ship market.

Today’s market size is the number of tons of freight moved by sea in 2000 and 2012. Of these totals, the percentage of freight moved in container ships, and thus for the most part finished goods as opposed to raw materials, was 10% in 2000 and 16% in 2012.

Geographic reference: World
Year: 2000 and 2012
Market size: 5,984 and 9,297 million tons respectively
Source: “Figure 1.2 International seaborne trade, by cargo type, selected years, 1980-2012,” page 9, Reveiw of Maritime Transportaiton 2012, 2013, United National Conference on Trade and Developement, available online here.
Original Source: United Nations
Posted on August 19, 2013

Wireless Systems in Cars

Nearly all automakers offer some sort of wireless network in their cars, such as General Motors’ OnStar and Ford’s SYNC. Data show the estimated revenue from wireless devices in cars in 2013. This figure is projected to increase tenfold by 2025.

Geographic reference: United States
Year: 2013
Market size: $2.5 billion
Source: Andy Greenberg, “Digital Carjackers,” Forbes, August 12, 2013, pages 44-46
Original Source: GSMA, a mobile industry trade group
Posted on August, 15, 2013

Map Apps

According to IHS Automotive, one in four U.S. cars now comes with a navigation system. Globally, installations of dashboard navigation systems are estimated to reach 13.8 million by the end of 2013. Typically, automakers charge between $500 to more than $2,000 for these systems. Even standalone GPS systems tend to cost hundreds of dollars. In addition to high cost, these systems come preloaded with maps and are not connected to the internet, thereby making them more difficult to update. In some cases, a trip to the dealership is necessary.

In contrast, smartphone and tablet map apps are internet-connected, easy to update, often give real-time traffic information and in some cases can be downloaded for free. In 2012, 47% of car owners said that they used a smartphone map app while driving, up from 37% in 2011. Makers of dashboard navigation systems have taken notice. General Motors’ OnStar, Garmin, and TomTom all have created map apps of their own, ranging in price from $36 to $150. In some cases, these apps run both on mobile devices and on a car’s dashboard.

Today’s market size is the number of map app downloads in the U.S. in May 2013, an 11% increase from the total downloaded in May 2012.

Geographic reference: United States
Year: May 2013
Market size: 79.1 million
Source: Keith Naughton, “OnStar, Garmin Try to Keep Pace with Waze, Other Free Navigation Apps,” Bloomberg Businessweek, July 25, 2013, available online here.
Original Source: ComScore
Posted on August 13, 2013

Newspapers

Newspapers

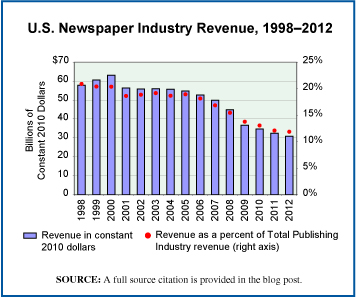
The news this week about The Washington Post being purchased for $250 million by Amazon founder Jeff Bezos made us want to update an earlier post about the newspaper industry, here. And so, we present today’s market size post, including a chart that shows U.S. newspaper industry revenues, annually, since 1998. Clearly, an industry going through significant change.

Geographic reference: United States
Year: 2000 and 2012
Market size: $50.29 billion and $32.04 billion respectively
Source: “Table 3.0.1 Information Sector Services (NAICS 51) &Mdash; Estimated Revenue for Employer Firms: 1998 Through 2004,” Service Annual Survey, April 2006, page 24, available online here, and annual updates of the same which are available on the Census Bureau’s site here.
Original Source: U.S. Census Bureau
Posted on August 9, 2013

Moroccan Argan Oil Hair Products

Some say it strengthens hair and tastes good drizzled on a salad. Moroccan argan oil is the latest new trend in the personal-care market. Argan oil is appearing in more and more products as one of the highlighted ingredients. Under fairtrade production standards, dime-sized kernels from acorn-shaped nuts are extracted by hand by Moroccan women earning the equivalent of $4 a day. These kernels are then ground down and the oil extracted. The wholesale price of argan oil in 2011 was approximately $30 per liter while in beauty boutiques around the world, a liter of argan oil sells for around $400.

In 2012, Morocco exported 700 tons of the oil, twice that exported in 2007. Today’s market size is the number of hair products containing argan oil that were introduced in 2008 and 2012.

Geographic reference: United States
Year: 2008 and 2012
Market size: 29 and 588 respectively
Source: Matthew Boyle, “Cosmetics’ Hot Elixir: Argan Oil From Morocco,” Bloomberg Businessweek, July 25, 2013, available online here.
Original Source: Mintel
Posted on August 6, 2013

High-Deductible Health Insurance Plans

High-deductible health insurance plans are insurance policies in which consumers pay lower monthly premiums, but incur higher out-of-pocket costs when visiting doctors and hospitals. In the past decade, high-deductible health plans have become more common. Some believe that these insurance policies will reduce overall health spending, especially on discretionary services, and thereby keep premiums affordable. But some studies show that while trips to the emergency room are reduced, especially for minor ailments, many consumers are also forgoing getting treatment for more serious conditions such as kidney stones or heart trouble. And, when treatment is sought, the cost of treatment is higher due to the increased severity of the illness.

Today’s market size is the number of consumers in the United States with high-deductible health insurance plans as of early 2013, a three-fold increase since 2006.

Geographic reference: United States
Year: 2013
Market size: 13.5 million
Source: Ashley Griffin, “Men Put Off Health Care When It Costs More,” Lansing State Journal, July 21, 2013, pages 1C, 4C
Posted on August 2, 2013

Detroit Housing Stock

Much has been written in the national press about Detroit over the last week and in the wake of that city’s filing for bankruptcy protection on July 18th. The debates about how the situation was allowed to get so bad and what is to be done now have been lively. For those of us who live in the shadow of this once great city, none of this is new. These debates have raged here for years, and the march to insolvency has been a long one, like a Greek tragedy playing out in slow motion. It is the true scope of the challenge that is difficult for those not familiar with Detroit to fully understand.

Today’s market size post is the size of the housing market in the City of Detroit, more specifically, the total number of housing units in that city. The figure provided includes housing units that are not habitable, in fact, when one calculates the percentage of housing units in Detroit that are actually occupied the number is only around 20%. To further place this housing stock figure into context, the population of the city is also provided below as is the median sale price of a home in Detroit.

Geographic reference: Detroit
Year: 2011
Market size: Housing Units: 1,886,537
Market size: Population: 701,500 (2012)
Market size: Median Home Sale Price: $9,568 (in May of 2013 this median price had risen to $11,100)
Source: [1] “Detroit (city), Michigan,” State and County QuickFacts, a presentation of current U.S. Census data made available online here. [2] JC Reindl, “Chapter 9 Unlikely to Hurt Home Prices,” Detroit Free Press, page B1, July 21, 2013. [3] Charles B. Stockdale, Douglas A. McIntyre and Michael B. Sauter “American’s Ten Sickest Housing Markets,” NBCNews.com, August 5, 2011, available online here.
Original Source: U.S. Census Bureau, S&P/Case-Shiller and Realcomp
Posted on July 23, 2013