Used Hybrid Cars

The used car market is doing quite well having benefited from the sudden decline of automobile leases during the aftermath of the financial crisis of 2008–2009. Expiring auto leases are a primary source of cars feeding the used car market. Hybrid gas-electric cars are a small subset of the overall used car market, primarily because they are a small part of the overall market. Another reason has to do with the fact that hybrid gas-electric cars need to have new battery systems after either five years of use or 100,000 miles, on average. These battery systems, depending on the vehicle, run anywhere in price between $2,000 and $6,000.

Today’s market size is the estimated number of used hybrid gas-electric vehicles on the U.S. used car market in early 2013.

Geographic reference: United States
Year: 2013
Market size: 415,000 vehicles
Source: Ann Carrns, “Tips for Buying and Servicing a Used Hybrid Car,” The New York Times, May 30, 2013, available online here.
Original Source: Edmonds.com
Posted on June 4, 2013

Peppermint Oil

Chart

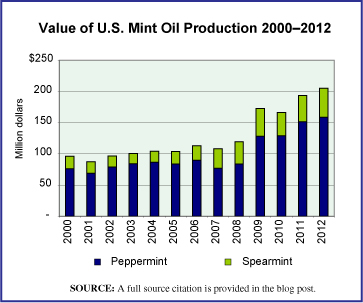
The price of mint oil, both peppermint and spearmint, has gone up sharply since the recession that started at the end of 2007. The chart shows value of U.S. mint oil production from 2000 through 2012. Much of the increase has been due to increased price of mint oil and not increased production. In fact, the production of peppermint oil fell over this period by 6.7% while the total value of the peppermint oil produced rose by 108%. Spearmint oil production over this period grew by 8.7% and the value of that oil grew by 134%.

Today’s market size is the number of pounds of peppermint oil produced in the United States in 2000 and 2012 and the value of the oil produced each year.

Geographic reference: United States
Year: 2000 and 2012
Market size: 7,063 pounds valued at $76.28 million and 6,592 pounds valued at $158.86 million respectively
Source: Crop Values – 2012 Summary, February 2013, page 43 and earlier reports in this annual series. These reports are produced by and put out annually by the United States Department of Agriculture, accessible in multiple formats on their web site here.
Original Source: USDA
Posted on May 24, 2013

Organic Products

Currently there are more than 17,000 certified organic businesses in the United States. In 2011, sales of organic foods made up more than 4% of all food and beverage sales. In 2012, sales of organic products grew 10%. Growth in this industry is expected to continue due to increasing consumer demand.

Today’s market size is the dollar amount of organic product sales in United States in 2012.

Geographic reference: United States
Year: 2012
Market size: $35 billion
Source: Mary Clare Jalonick, “Demand Aids Organic Industry’s Sway,” Lansing State Journal, May 19, 2013, page 6A.
Posted on May 22, 2013

Apparel Exports from Bangladesh

The enormous loss of life resulting from the collapse of a garment factory in Bangladesh a few weeks ago has brought the media spotlight onto that country, as well as the global network of low-end apparel manufacturing. Bangladesh, with a population of approximately 164 million, is the world’s second largest exporter of apparel. The first largest is China with 1.35 billion people.

Today’s market size is the value of all apparel exports from Bangladesh last year. Of that total, a quarter came as general imports to the United States ($4.47 billion).

Geographic reference: Bangladesh
Year: 2012
Market size: $18 billion
Source: Adam Davidson, “Clotheslined,” The New York Times Magazine, May 19, 2013, pages 16-17.
Original Source: A&M University, Texas, Prof. Munir Quddus
Posted on May 20, 2013

Cast Iron Cookware

Photo of cast iron pot and pan

In the past 10 years, sales of cast iron cookware has gone from 4 percent to 10 percent of the entire cookware market. Lodge Manufacturing, founded in 1896 in the United States, and Le Creuset, founded in 1925 in France are two of the oldest manufacturers of cast iron cookware. Data show industry sales of cast iron cookware in 2011.

Geographic reference: United States
Year: 2011
Market size: $114 million
Source: Josh Ozersky, “A Pan for All Seasons,” Time, March 26, 2012, available online here.
Posted on May 14, 2013

Expenditures on Reading Materials

Graphic

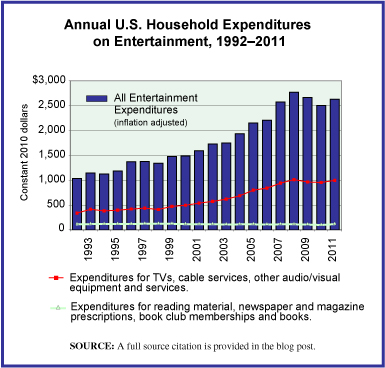
The U.S. Bureau of Labor Statistics (BLS) carries out an annual survey of millions of households to track what they spend money on, by category. The resulting data has been collected over decades and seeing the trends that these data expose over time is very interesting.

The graph presented here is made with BLS data from this survey series. It shows inflation adjusted household expenditures on all categories of entertainment, as well as two subsets of expenditures, (1) those for TVs, audio/video equipment and services, such as cable subscriptions and (2) expenditures for reading material. The full category of entertainment expenditures is broad and includes things such as:

—Fees to attend concerts, sporting events, movies, and sporting clubs/fraternal organizations.
—TVs, radios and other audio/video equipment as well as subscriptions for cable, premium TV and the like.
—Pets, toys and hobbies, as well as all the services and equipment related to those.
—Bikes, athletic shoes, and equipment for camping, exercising, fishing, and all sports, as well as boats and docking fees, fireworks, pinball machines and video consoles.

Today’s market size is the average spent by U.S. households on reading material in 1994 and in 2011. The figures do not include expenditures for any text books or reading material purchased as part of a formal educational program. The transition to digital which is taking place in most areas of publishing is not well tracked by this BLS survey series. It is unclear from studying the survey results, for example, whether or not all online subscriptions to newspapers and magazines are consistently captures in the expenditure category “Reading.” Over time this will change as time allows data collection organizations, like the BLS, to adjust to the digital transition. Data collection organizations can only adjust as quickly as the industries they cover—in this case the publishing industry—adjust to such dramatic changes.

Geographic reference: United States
Year: 1994 and 2011
Market size: $165 and $115 respectively. These figures translate to a national gross household spending on reading materials for each of those years of $16.86 billion and $14.06 billion respectively
Source: “Consumer Expenditure Survey,” Multiyear Tables: 1992-99 Multiyear Table, 2000-05 Multiyear Table, and 2006-11 Multiyear Table, all available on the Bureau of Labor Statistics web site here.
Original source: U.S. Department of Labor, Bureau of Labor Statistics, Consumer Expenditure Surveys
Posted on May 9, 2013
The Clothes We Buy

The decline of apparel manufacturing in the United States is an interesting development and outcome of globalization over the last decade or two. It is estimated currently that only 2% of apparel purchased in the United States is made in the United States.

Today’s market size is the value of imported apparel and accessories into the United States in 2002 and 2012.

Geographic reference: United States
Year: 2002 and 2012
Market size: $62.31 and $81.19 billion respectively
Source: “U.S. Interational Trade Statistics,” (315 Apparel and Accessories), a searchable database presented by the Census Bureau and available online here.
Original source U.S. Department of Commerce, Bureau of the Census
Posted on May 6, 2013

Plastic Surgery

Procedures that fall under the umbrella of plastic or cosmetic surgery include a wide range. They include minimally intrusive procedures such as laser hair removal and injections of Botulinum toxin or Collegen. They also include more extensive, often reconstructive procedures that necessary to restore a person after an accident, animal bite, for other surgery to remove a tumor, for example.

Today’s market size is the number of, and estimated total spent on, cosmetic surgical procedures performed in the United States in 2012. This includes all surgical procedures but does not include the minimally-intrusive procedures such as chemical peels, laser hair removal nor soft tissue filling procedures. In terms of spending, cosmetic surgeries make up 55.6% of the total spent on all cosmetic procedures and in terms of number of procedures, surgeries account for 10.9% of all procedures.

Geographic reference: United States
Year: 2012
Market size: 1,594,526 surgeries valued at $6.12 billion
Source: 2012 Plastic Surgery Statistics Report, “2012 Average Surgeon/Physician Fees,” page 20, 2013, American Society of Plastic Surgeons, available online here.
Posted on May 3, 2013

World Labor Force

LaborForce

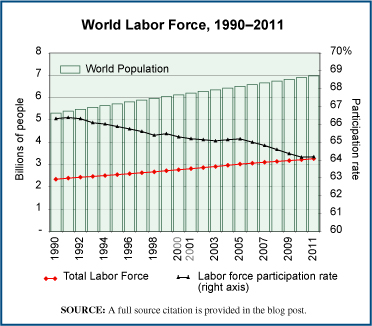
On May first, International Labor Day, we thought it only right to report on the world labor force. The graph shows, as a red line, the number of people in the labor force worldwide from 1990 through 2011. These data come from the World Bank which defines the labor force as follows:

Total labor force comprises people ages 15 and older who meet the International Labour Organization definition of the economically active population: all people who supply labor for the production of goods and services during a specified period. It includes both the employed and the unemployed. While national practices vary in the treatment of such groups as the armed forces and seasonal or part-time workers, in general the labor force includes the armed forces, the unemployed, and first-time job-seekers, but excludes homemakers and other unpaid caregivers and workers in the informal sector.

The labor force is, of course, a subset of the overall population and so we’ve included world population on the graph, as well as labor force participation rates, annually. Over the period 1990–2011 the labor force participation rate has actually declined, slightly, from 66.32% to 64.18%. Yet the labor force has grown at a faster rate than has population overall, 39.3% for the participation rate versus 31.4% for world population. Growing longevity is part of the reason for this seeming divergence.

To labor and laboring, within or outside the official labor force!

Geographic reference: World
Year: 2011
Market size: 3.26 billion.
Source: “Labor Force, total,” part of a data set maintained by The World Bank and available online here. World population data are from the United Nations, Deptartment of Economic and Social Affairs, Population Division (2011).
Original source: The United Nations and The World Bank Group
Posted on May 1, 2013

Psychiatric Hospitals

A great deal of attention is paid to the health care industry and its remarkable rates of growth. However, one segment of that industry has not experienced growth, has in fact shrunk. That segment is psychiatric hospitals. Because of changing policies and attitudes about how the mentally ill should be treated, psychiatric hospitals have been on a steady decline for many decades in the United States. The number of beds available in psychiatric hospitals in 1955 was equal to 1 bed for every 300 people in the general population. In 2005, that number had fallen to 1 bed for every 3,000 people.

Yet the rate of serious mental illness in the society has not changed during the fifty years between these two measures. This means that many, many mentally ill people end up incarcerated and/or, when they reach a breaking point, in the emergency rooms of general hospitals. According to a 2007 report from the National Health Policy Forum, there were nearly 2 million admissions to general hospitals in 2004 of patients suffering from mental health problems. Clearly, demand for some important things is not met through the mechanisms of a free market.

Today’s market size is the number of beds available in psychiatric hospitals in the United States in 2005.

Geographic reference: United States
Year: 2005
Market size: 99,800
Source: “More Mentally Ill Persons Are in Jail and Prison Than Hospitals: A Survey of the States,” a report published by the National Sheriffs Association and the Treatment Advocacy Center, May, 2010, available online here. Eileen Salinshy and Christopher Loftis, PhD, “Shrinking Inpatient Psychiatric Capacity: Cause for Celebration or Concern?” National Health Policy Forum, August 1, 2007.
Posted on April 30, 2013