Garage Storage and Organization

Products purchased to help organize the garage constitute the fastest growing segment of the home storage and organization market. In recent years, the garage has become more than just a place to park cars. Only 35% of garages made to fit at least two cars have room for more than one. While many homeowners use their garage for storage, there’s a growing segment of the population that use their garage as an extension of their home — installing granite floors, wide-screen televisions, and state of the art sound systems.

Data show the projected size of the garage storage and organization market in the United States in 2015. That year, the total home storage and organization market is expected to reach $9 billion, which means that the garage segment will represent nearly a fifth of the total market. Managing all of our stuff has become a real job and for some, a business.

Geographic reference: United States
Year: 2015
Market size: $2 billion
Source: Jayne O’Donnell, “Garages Can Be a Man – Or Woman – Cave,” Detroit Free Press, April 21, 2013, available online here.
Original source: Freedonia Group
Posted on April 25, 2013
Açaí Berries and Superfoods

The açaí berry is native to the Amazon rainforest and in particular to Brazil. It is a berry that has high quantities of phytochemicals, plant compounds that are believed to protect us from a variety of ills, from heart disease to cancer. Through heavy marketing of the berry as a sort of miracle cure, a market for this fruit was created and grew rapidly, reaching a high in 2009.

The açaí berry is what is often called a superfood, a category of foods that are nutrient dense, thus rich in vitamins, minerals and other nutrients while having few calories. So-called superfoods that are new to the U.S. market appear to follow a somewhat predictable cycle. They become the hype new health food. Demand for them rises sharply and they ride this tide. Then they begin a decline as their high prices are balanced against the consumers experience with them and the promise of a new, heavily marketed superfood. Worth noting is the fact that blue berries are very nearly as rich in polyphenols as are açaí berries yet they are priced at a fraction of the price of açaí berries.

Today’s market size is an estimate of the total value of açaí-laced products sold in the United States in 2012.

Geographic reference: United States
Year: 2012
Market size: $200 million
Source: Tom Philpott, “Farm to Fable,” Mother Jones, pg 68, May/June 2013
Posted on April 23, 2013

Petroleum Product Imports from Egypt

Petroleum from Egypt

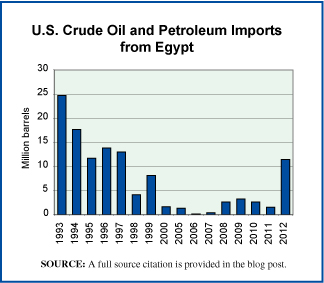
The graph to the right shows crude oil and petroleum product imports to the United States from Egypt, from 1993 through 2012. The trade in petroleum products is one that is strongly influenced by geopolitical concerns. The rise in imports from Egypt into the United States in 2012 may well be seen, at least in part, as an attempt by the United States to help stabilize that country after its revolution of 2011.

Egypt’s domestic consumption of its fuel has been rising steadily for decades as it’s population increased rapidly. Consequently, its exports of petroleum products (from crude oil to fuel ethanol) declined. However, when one of its major industries, tourism, was devastated by the upheavals of 2011 and continued political unrest in wake of the revolution, Egypt has been forced to increase exports in other areas as much as possible in order to meet its foreign currency debt payment obligations.

Today’s market size is the number of barrels of crude oil and petroleum products imported by the United States from Egypt, in 2012.

Geographic reference: United States and Egypt
Year: 2012
Market size: 11.44 million barrels, or 0.29% of all such imports into the United States that year.
Source: “U.S. Imports by Country of Origin,” a detailed statistical presentation on “Petroleum & Other Liquids,” dated March 15, 2013, published by the U.S. Energy Information Administration. The table is available online here.
Original source: U.S. Energy Information Administration
Posted on April 18, 2013

Trade Books

The Association of American Publishers (AAP) tracks the sales of its members. It has had an increasingly difficult task in tracking sales over the last decade or so, as the industry deals with dramatic changes in distribution networks (bookstores), in the product itself (print versus digital) and in the rise of self-publishing. The AAP report on 2012 sales shows a 7.4% improvement in the sale of trade books over 2011. Trade books are defined as those intended for general readership and are sold through a general retail outlet—whether fiction or non fiction, print or e-book, and/or bricks-and-mortar stores or online sales. The total value of trade book sales in 2012 was, however, far short of that reached in 2007, the peak year for sales during the first decade of the new century.

Today’s market size is based on the sale of trade books, published by the large and middle sized American book publishers—AAP members—in 2007 and 2012.

Geographic reference: United States
Year: 2007 and 2012
Market size: $8.53 billion and $6.53 billion respectively
Source: “Today’s Lunch: Weak December Doesn’t Spoil 2012 Trade Gain of 7.4 Percent,” article in the April 11, 2013 Publishers Lunch newsletter. Access to the newsletter’s web site is here. The data on 2007 sales comes from “Association of American Publishers 2009 S1 Report — Estimated Book Publishing Industry Net Sales 2002-2009,” available online here.
Original source: Association of American Publishers
Posted on April 12, 2013

Craft Beers

Beer consumption and median age of population

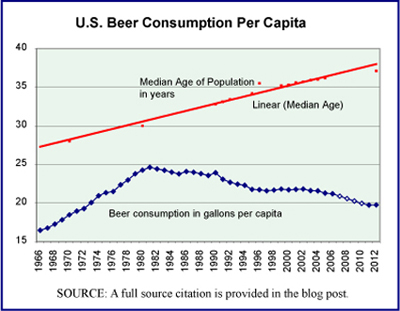
While the overall U.S. consumption of beer, measured in terms of per capita consumption, has been declining steadily since the 1980s, as can be seen in the graphic, the craft beer market has been doing quite well. Craft beers are those made by brewers whose annual production is less than 6 million barrels, who use traditional methods of brewing and are independently owned. The number of craft brewers in the United States has risen from 1,753 in 2010 to 2,403 in 2012 and craft brewers in 2012 accounted for 6.5% of the overall beer market by volume and 10.2% by value of sales.

The graph presents per capita beer consumption in the Untied States from 1966 through 2012 with a red line showing the median age of the U.S. population.

Today’s market size is based on sales of craft beer in the United States in 2012, by volume and value. In volume terms, craft beers grew by 15% between 2011 and 2012 and by value it grew by 17%.

Geographic reference: United States
Year: 2012
Market size: 13.24 million barrels (410.44 million gallons) valued at $10.2 billion.
Source: “Craft Brewing Facts,” Brewers Association, March 18, 2013, available online here. The graphic comes from Patricia J. Bungert and Arsen J. Darnay, editors, Encyclopedia of Products & Industries — Manufacturing, Figure 19, page 96, Gale Cengage Learning, 2008, updated here with data cited above from the Brewers Association’s web site.
Original source: Brewers Assocaiton and U.S. Census Bureau
Posted on April 10, 2013

Cloud Computing Services

In recent years more and more companies have been putting their data “in the cloud.” There are 625 million subscribers to cloud document storage services. That number is expected to reach 1.3 billion in 2017. Cloud computing service companies allow users to store data on the service provider’s remote servers from which users can access that data from anywhere using Internet-based software and a computer or mobile device. While this can be a cost-saving measure for companies, securing the data on public servers is still a concern. After recent high-profile security breaches at such companies as Nasdaq, LinkedIn, and Twitter, many cloud service companies have invested in tighter security systems for their servers.

Today’s market size data show the amount of revenue from public clouds in 2011 and projected revenue for 2016. Currently, 25% of all business information globally is held on Servers that are part of what is referred to as the cloud.

Geographic reference: World
Year: 2011 and a projection for 2016
Market size: $19.4 billion and $206.6 billion respectively
Source: Steve Johnson and Scott Davis, “In the Cloud,” Lansing State Journal, March 24, 2013, pages 1E, 4E.
Posted on April 8, 2013

U.S. Prison Population

U.S. Prison Population, 1980-2011

The number of people in prison in the United States is the highest in the world when calculated in terms of number per capita. The U.S. incarceration rate as of December 31, 2011 was 492 people per 100,000 in the population, and this did not count those in jail, awaiting trail or serving very short sentences. Those in jail increase the total number incarcerated by three quarters of a million people. The chart shows the number of prisoners in the United States, annually, between 1980 and 2011 and includes only those in federal or state prisons but not those in jail.

Today’s market size is the number of people in the United States under the jurisdiction of state or federal corrections authorities as of December 31, 2011. These are people convicted of a crime and serving a prison term.

Worth noting is the fact that 8% of those in prison (at the end of 2010) were housed in private prisons run for profit. Leaders in the private prison business are CCA (Corrections Corporation of America) and GEO Group, Inc. which together account for approximately half of the prison contracts in the United States. As of January 1, 2011, 31 states contracted with private companies to house a portion of their prisoners. Texas had the largest number of prisons in privately run prisons, 19,155 or 11% of its prison population. New Mexico had the largest percentage of its prison population housed by private prisons, 43.6% or 1,503 prisoners.

Geographic reference: United States
Year: 2011
Market size: 1,598,780 people
Source: E. Ann Carson and Willaim J. Sabol, “Prisoners in 2011,” December 2012, a Bulletin published by the U.S. Department of Justice, Bureau of Justice Statistics, and available online here. The figures related to private prisons come from Cody Mason, “Too Good to be True, Private Prisons in America,” January 2012, The Sentencing Project. The data for the graphic came from the above cited Department of Justice report as well as the Statistical Abstract of the United States, 2004–2005, page 208, “Table 338–Federal and State Prisoners, by Sex, 1980 to 2002,” Bureau of the Census.
Original source: U.S. Bureau of Justice Statistics and U.S. Census Bureau
Posted on April 4, 2013

3D Printing

The term 3D printing is catchy and the arrival on the market of consumer level 3D printers in 2012 has brought a great deal of attention to the subject. In essence, 3D printing may be defined as follows: A way of making objects using a computer-driven, additive process, one layer at a time. A computer aided design (CAD) system is used by a printer-like machine which creates thousands of cross sections of the designed object and then produces that object, in plastic or metal, layer by layer. Although the name is relatively new, the technology behind 3D printing emerged in the 1980s for use, primarily, in the manufacturing sector.

There are two distinct branches of 3D printing: (1) small scale 3D printing, where individuals or small groups with comparatively cheap machines print plastic objects in their homes or small shops, and (2) industrial 3D printing, which is usually called additive manufacturing (AM). The current industrial applications of 3D printing (primarily the creation of models, molds and dies) are seen by many as having the potential to have a revolutionary impact on manufacturing as a whole, in part because of its replacement of more traditional machine tooling tasks.

Today’s market size is an estimated value of the 3D printer market in 2012 and a forecast as to its value within a decade. This forecast comes from a gentleman who is a founding member of a company selling 3D printers to the public, 3D Systems. His forecast may refer only to 3D printers sold for non industrial applications, in other words, the first of the two branches of this market, as described above.

Geographic reference: World
Year: 2012 and 2022
Market size: $500 million and $35 billion respectively.
Source: Abe Reichental in a video interview with the Financial Times, “3D printing bigger than internet,” June 21, 2012, available online here. “How Will 3D Printing Impact The Manufacturing Industry?” Seeking Alpha, March 18, 2013, available online here.
Original source: 3D Systems
Posted on April 2, 2013

Used Car Market

Today’s market size is the number of used cars sold in the United States in 2012, a quantity that is 5% above the 2011 total. Many large scale trends and factors play into the market for used vehicles, many of them related directly to how the new car market is doing. Therefore, to suggest that the losses from a natural disaster might play a role in the overall annual market for used cars is probably somewhat over stating matters. However, the loss of a quarter million cars in the hurricane that hit the east coast of the United States last fall, Hurricane Sandy, may well have played a small role in the 5% rise in used car sales during 2012. It may also bode well for used car sales in 2013.

Geographic reference: United States
Year: 2012
Market size: 40.5 million cars
Source: Mike Ramsey, “Amid New Car Boom, Used Cars Are Gold,” The Wall Street Journal, February 21, 2013, available online here. Michael Winerip, “Not Just a Car, but a Storm Victim, Too,” The New York Times, S12, March 17, 2013.
Original source: Manheim Consulting and National Insurance Crime Bureau
Posted on March 22, 2013

Nutritional Supplements Market

The market we’re presenting today is one that includes a large range of ingestible products, from vitamins and calcium pills to protein shakes, diet pills and energy drinks. The market is also referred to by various names, among them; nutritional supplements, dietary supplements, and simply, supplements. By whatever the name, this is a lucrative market and one that many people feel is less regulated than would be prudent. The federal guidelines regulating the ingredients used in the production of nutritional supplements are far less restrictive than those imposed on food and drink makers. Worth noting is the fact that federal requirements of pharmaceutical companies are even more restrictive than those regulating the food and drink industry. Nutritional supplements are not bound by the regulations for neither of these industries—food and drink nor pharmaceuticals.

The supplements market has been growing steadily since the turn of the century and is expected to continue growing. Driving the growth are a number of factors. An older population looking to supplements to minimize the effects of aging is one such driver. The young, too, are using supplements heavily. Having grown up in a society that appears to approve of the use of chemicals to augment human capacities of all sorts, they turn to supplements to help build muscle, lose weight, and stay awake.

Geographic reference: United States
Year: 2011
Market size: $30 billion
Source: Natasha Singer and Peter Lattman, “Is the Seller to Blame,” The New York Times, page B1, March 17, 2013, available online here. Brittany McNamara, “Monster Energy Switches from Supplement to Beverage,” Nutrition Business Journal, February 14, 2013, available online here.
Original source: Nutrition Business Journal
Posted on March 20, 2013